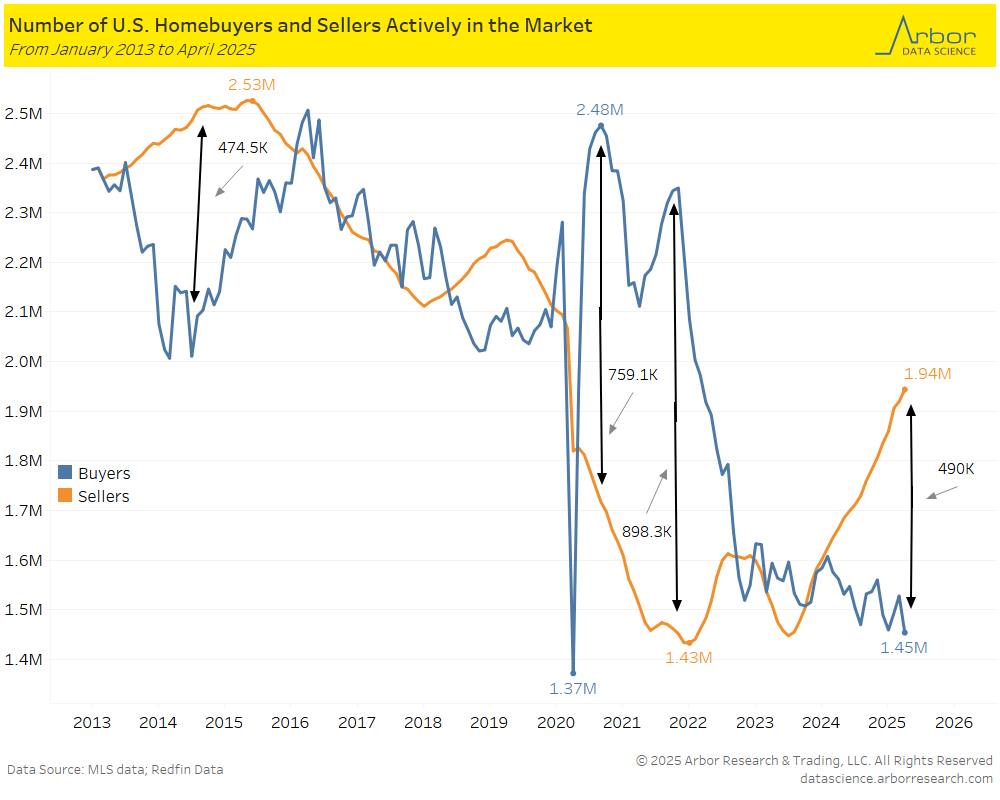
Supply and Demand… There Were Approximately 500,000 more Home Sellers than Homebuyers in April 2025
- According to Redfin, there were approximately 1.94 million home sellers in the U.S. housing market compared to 1.45 million homebuyers in the U.S. housing market in April 2025, for a difference of 490,000.
- As illustrated in the chart below, the last time the divergence between home sellers and homebuyers was greater than 500,000 was in 2021 and 2020. During those time periods, it was certainly a buyer’s market.
- In November 2022, homebuyers outnumbered home sellers by 898,300 and in September 2020, homebuyers outnumbered home sellers by 759,100.
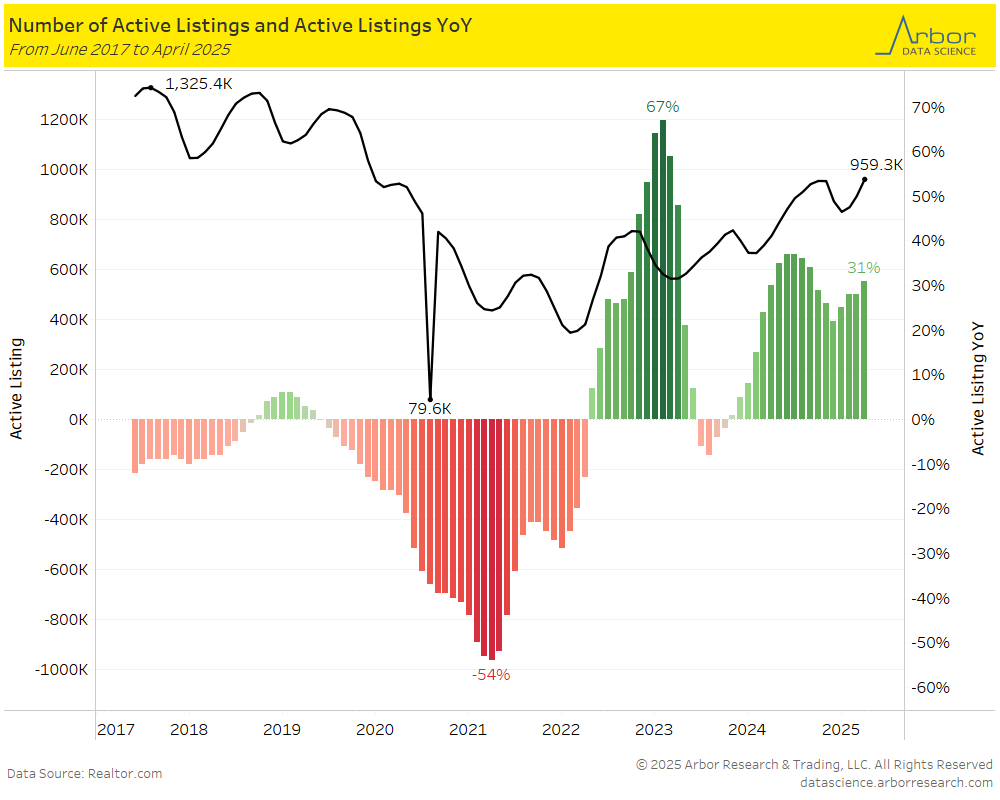
Perhaps No Surprise… Housing Inventory Trends Higher
- In April 2025, the number of active home listings increased 31% year-over-year with 959,251 number of active home listings in the U.S. The number of active listings has climbed steadily year-to-date with 829,376 active home listing in January 2025 (when the share of home listing was 25% higher compared to January 2024).
- Utilizing data from Realtor.com, the chart below outlines the number or active listings and the change year-over-year.
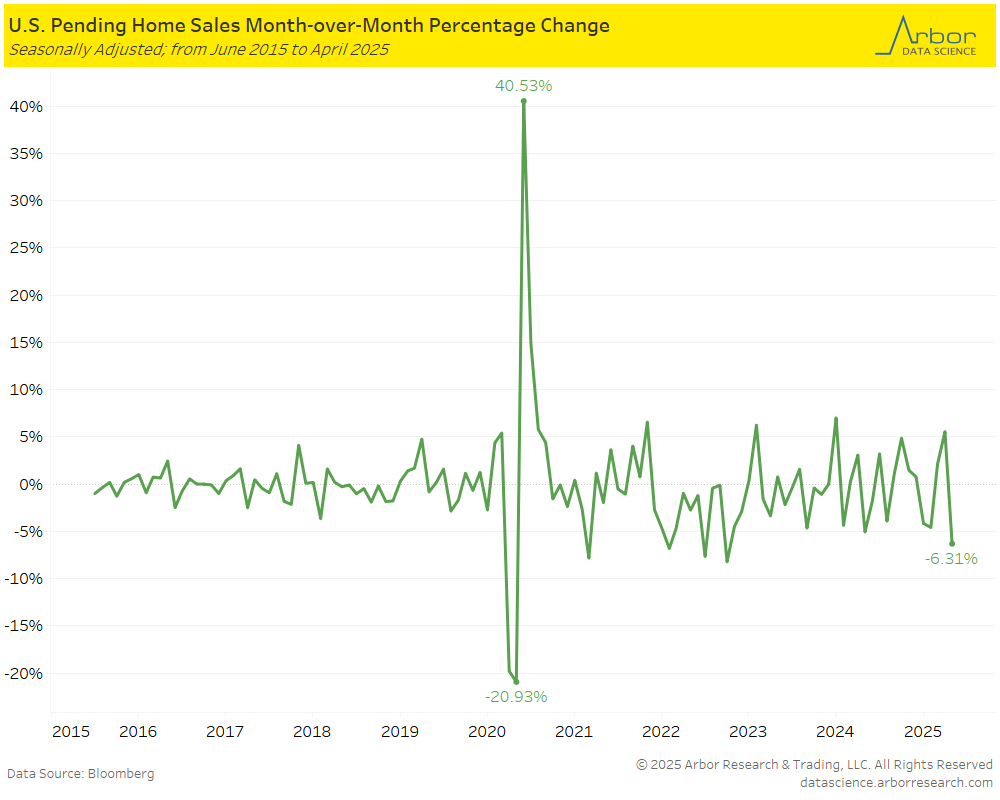
U.S. Pending Home Sales Declined 6.3% in April 2025
- In April 2025, the U.S. Pending Home Sales were down 6.3% from a month prior at 5.5% in March 2025. According to the National Association of Realtors, all four U.S. regions reported monthly declines in the number of pending home sale transactions.
- On a year-over-year basis, U.S. Pending Home Sales retracted 2.5% in April 2025.
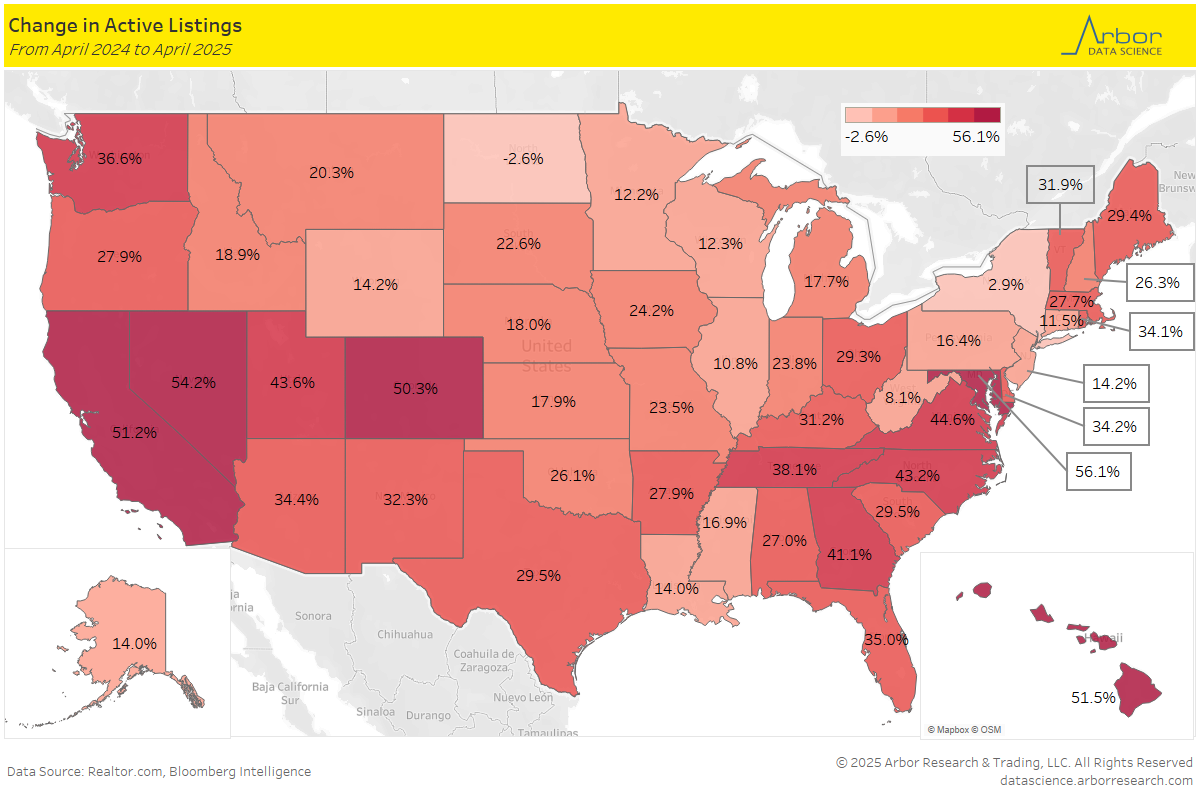
The next two heatmaps highlight the change in the number of active home listings in April 2019 compared to April 2025 (1st heatmap) and April 2024 compared to April 2025 (2nd heatmap).
The Change in Active Home Listings Between April 2019 to April 2025
- The states with the largest positive change in the number of active home listings from April 2019 – April 2025 were: Texas at 27.6%, followed by Colorado at 27.5% and Florida at 22.7%.
- The states where the number of active home listings contracted the most included: Connecticut at -75.2%, followed by New Jersey at -66.4% and Vermont at -65.4%.

The Change in Active Home Listings Between April 2024 to April 2025
- The states with the largest positive change from year-over-year from April 2024 – April 2025 included: Maryland at 56.1%, followed by Nevada at 54.2% and Hawaii at 51.5%.
- The states where the number of active home listings contracted the most included: North Dakota at -2.6%, followed by New York at 2.9% and West Virginia at 8.%.