Corporate Bankruptcies Trend Lower
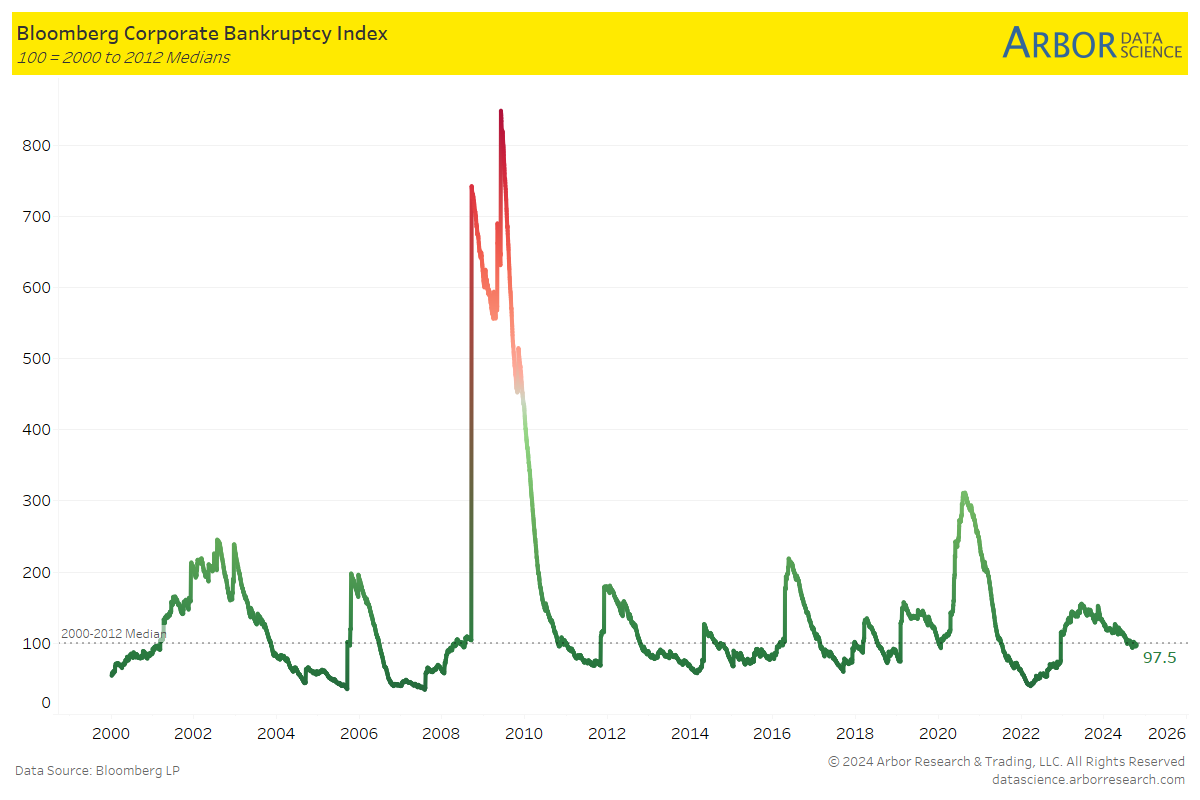
- The Bloomberg Corporate Bankruptcy Index, a barometer of bankruptcy activity, provides a snapshot of recent US bankruptcy activity for corporations with at least $50 million in liabilities.
- The Index has been below the 2000-2012 median of 100 since 9/25/24 when it was at 99.9. Most recently, on 10/1/24, the index was at 97.5.
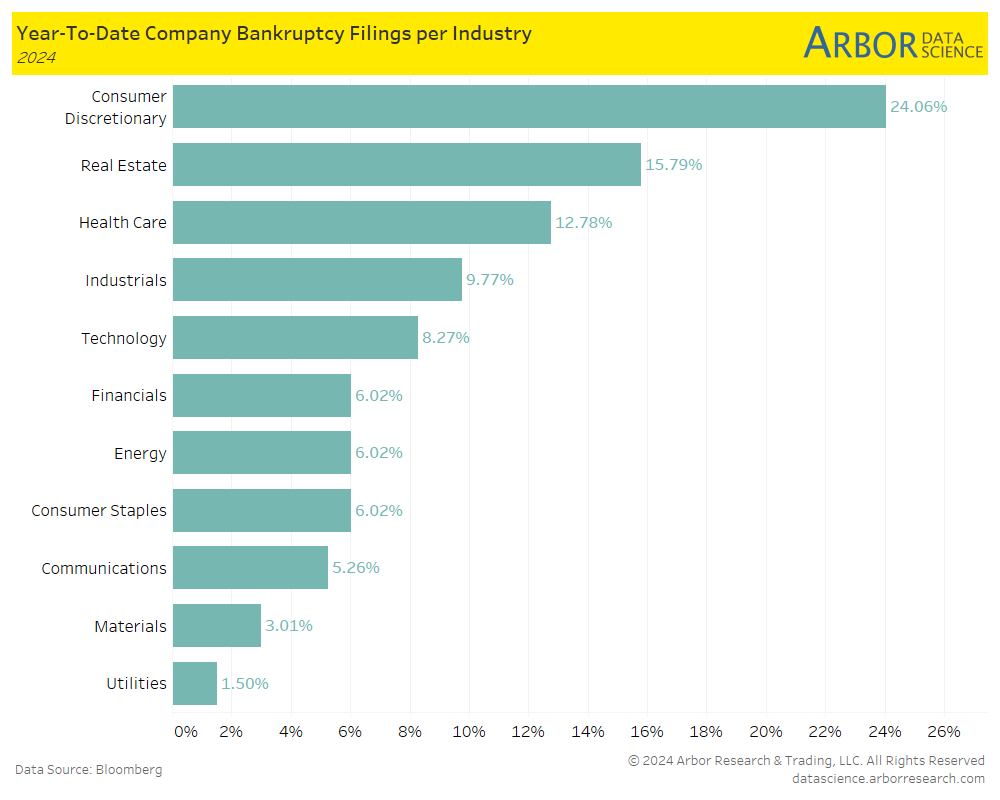
U.S. Bankruptcies in 2024 by Industry
- 24.06% of company bankruptcy filings in the U.S. year-to-date in 2024 have been in the Consumer Discretionary industry, followed by 15.79% in Real Estate and 12.78% in Health Care.
- Within the Consumer Discretionary sector (24.06%), it is further broken down by:
- 9.77% is Retail and Wholesale
- 8.27% is Consumer Discretionary Services
- 6.02% is Consumer Discretionary Products
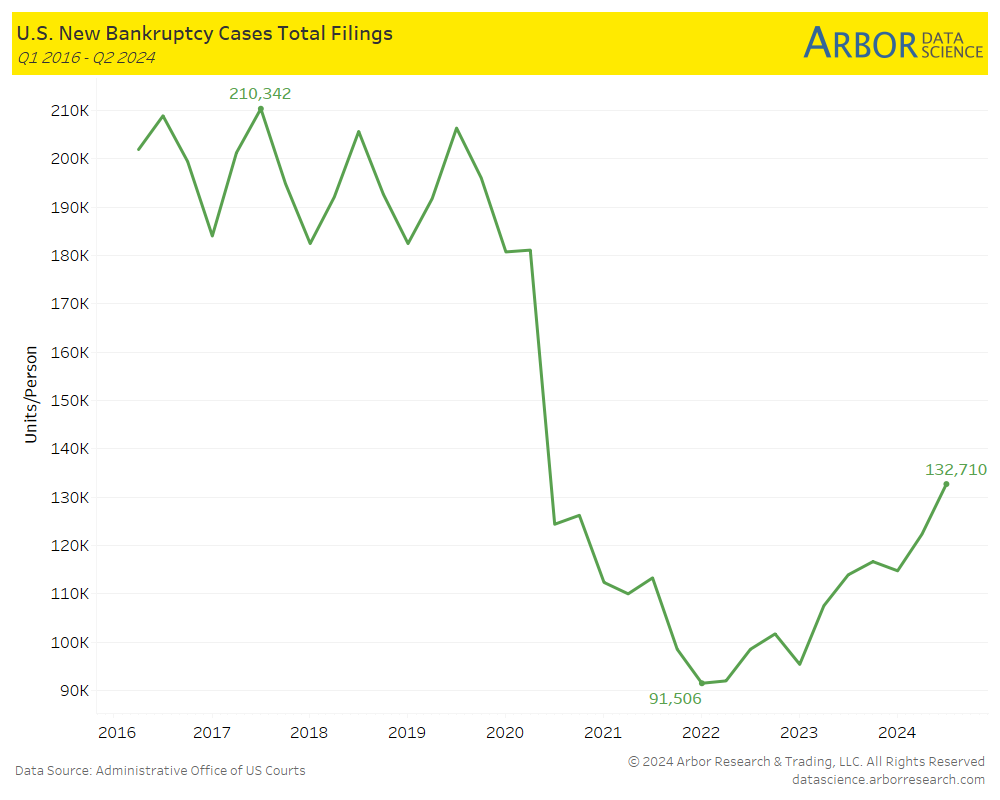
Meanwhile… the Total Number of Bankruptcy Cases (Business and Nonbusiness) in the U.S. are on the Rise
- The next chart illustrates the total number of new bankruptcy cases (both business and nonbusiness) in the U.S. based on the number of filings.
- Bankruptcy filings have been trending higher since Q4 2021 (at 91,506) and most recently, at Q2 2024, at 132,710.
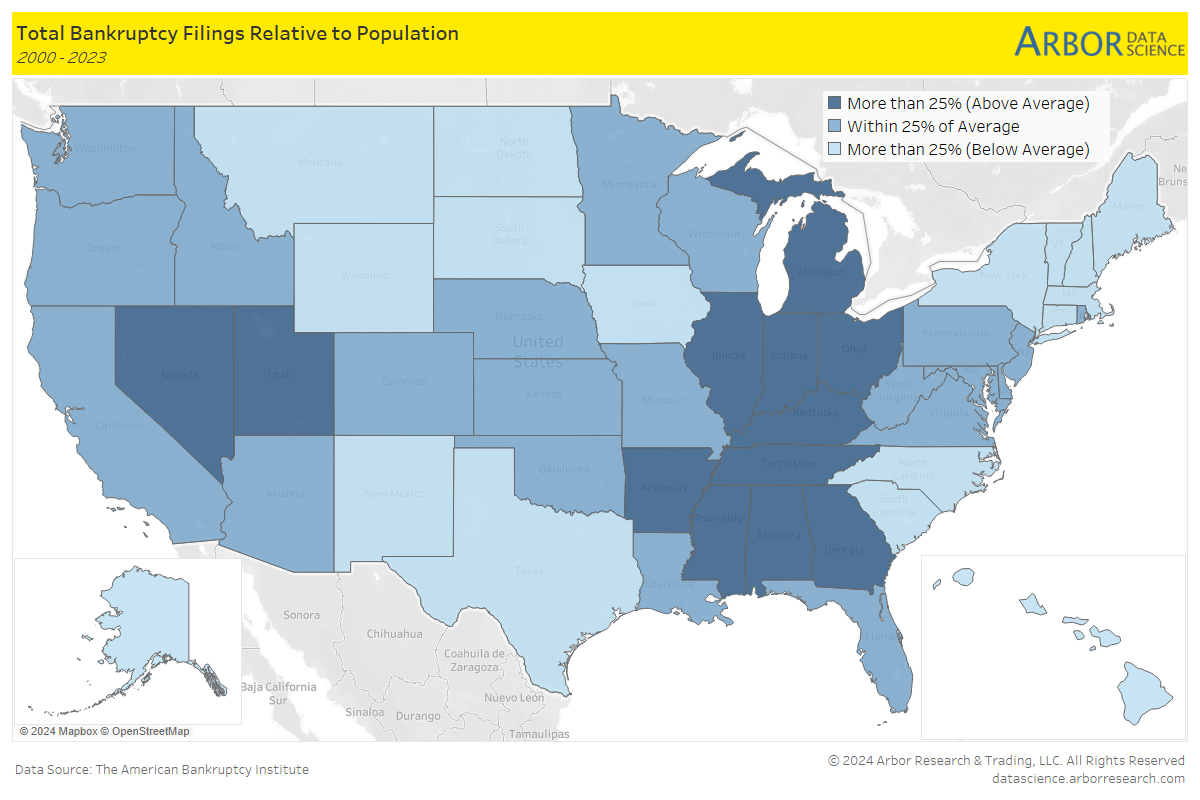
Bankruptcy Filings by State
- The heatmap below highlights the total bankruptcy filings relative to population in each state throughout the United States from 2000 to 2023. The darkest blue shading indicates the total number of bankruptcy filings in a state (relative to population) is more than 25% above average.


