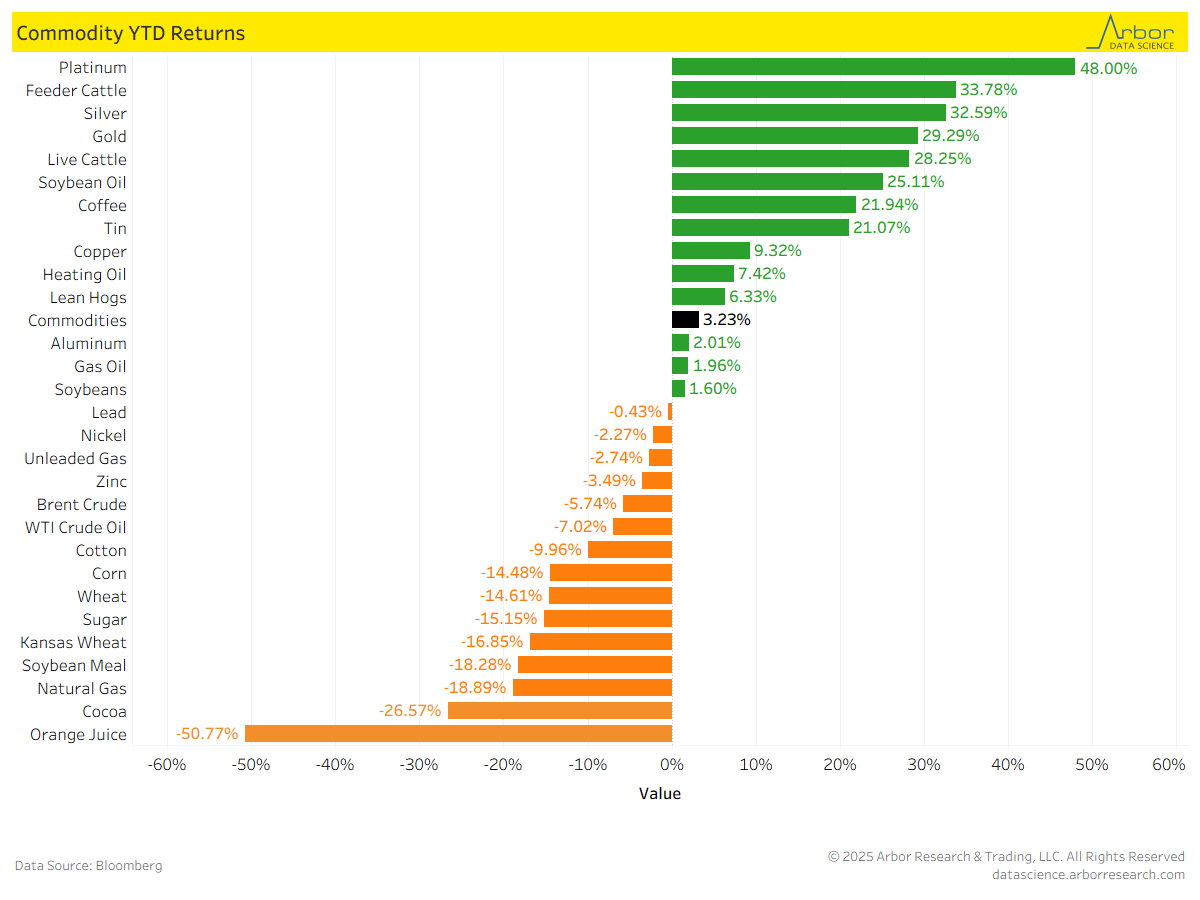
- Bloomberg’s Commodity Index, which is calculated on an excess return basis and reflects commodity futures price movements, was up 3.23% on a year-to-date (YTD) basis as of 9/5/25.
- YTD returns for commodities are shown in the chart below. Platinum has the highest YTD return at 48.00%, followed by Feeder Cattle at 33.78% and Silver at 32.59%.
- Orange Juice had the largest decrease, with a YTD return of -50.77%, followed by Cocoa at -26.57%.
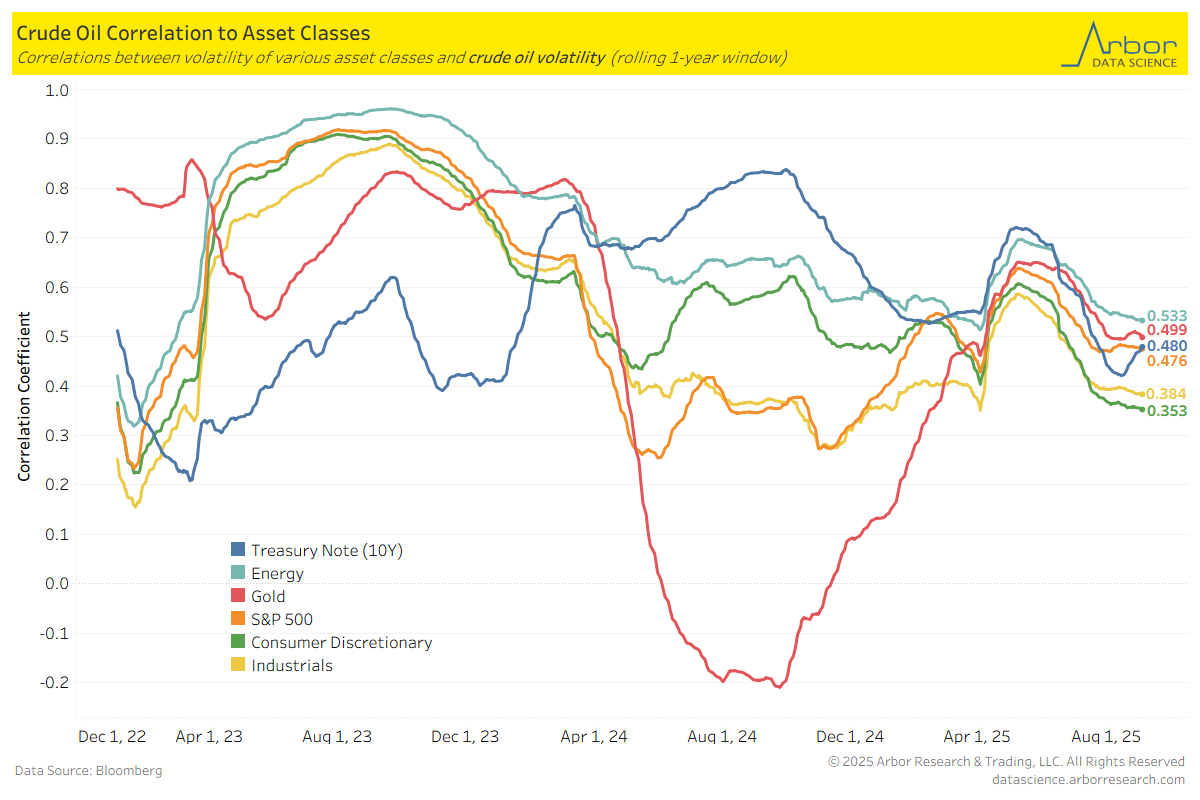
- The chart below illustrates the correlations between volatility of crude oil and volatility of various asset classes.
- As of 9/4/25, the Energy asset class is the most correlated to crude oil volatility, with a correlation coefficient of 0.533.
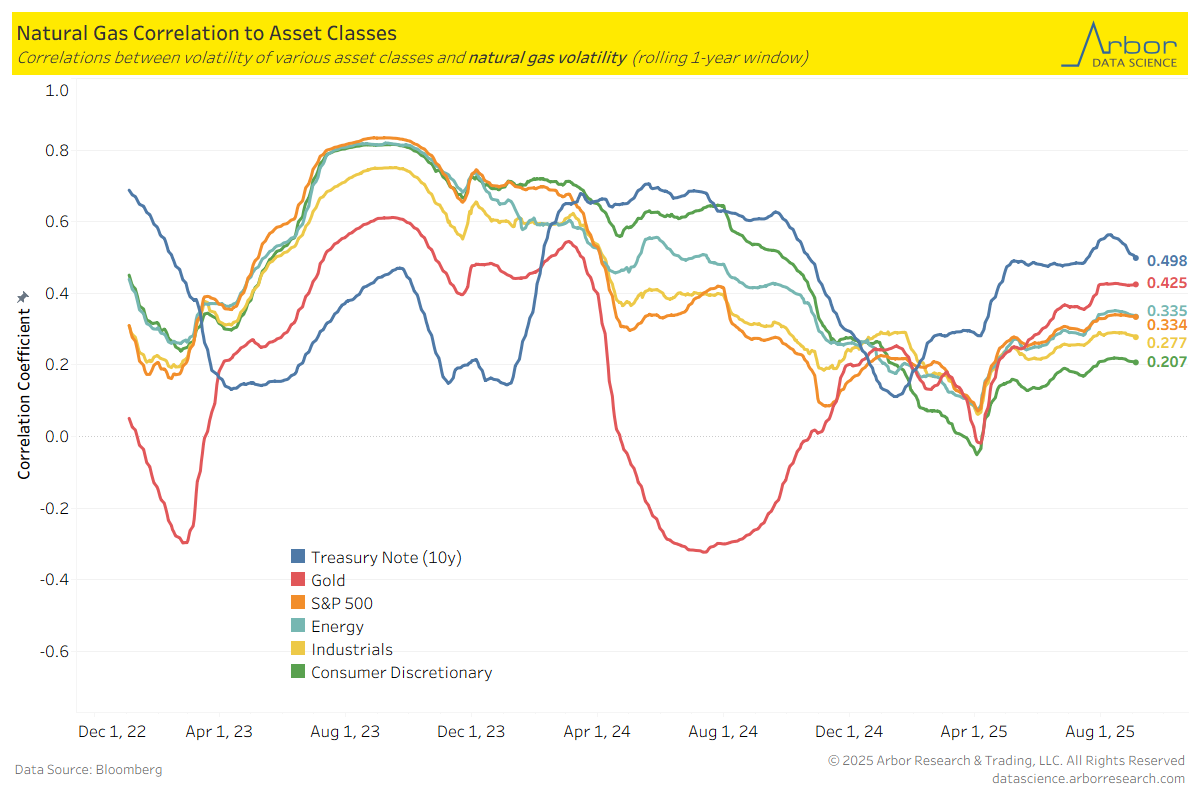
- The next chart outlines the correlations between the volatility of natural gas and the volatility of various asset classes.
- As of 9/4/25, the 10-year Treasury Note volatility is the most correlated to natural gas volatility, with a correlation coefficient of 0.498.
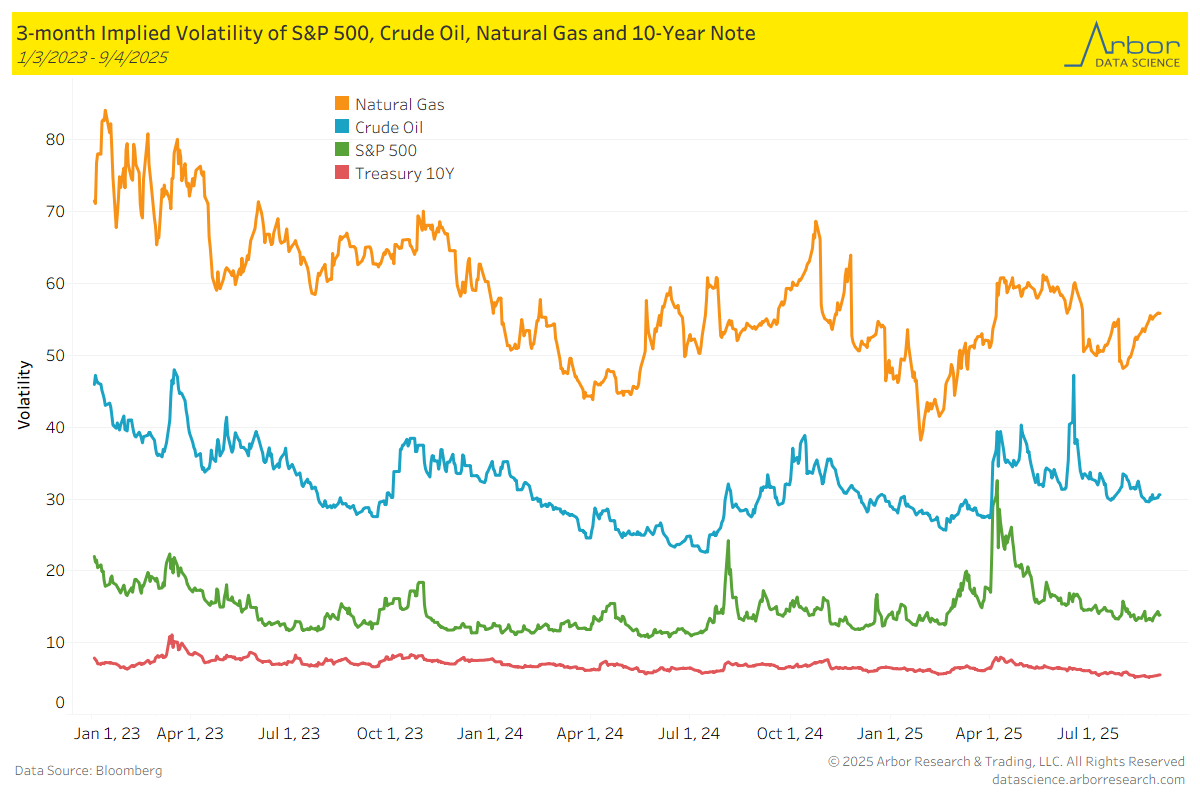
- The chart below highlights the 3-month implied volatility of the S&P 500, crude oil, natural gas, and the 10-Year Note as of 9/4/25.
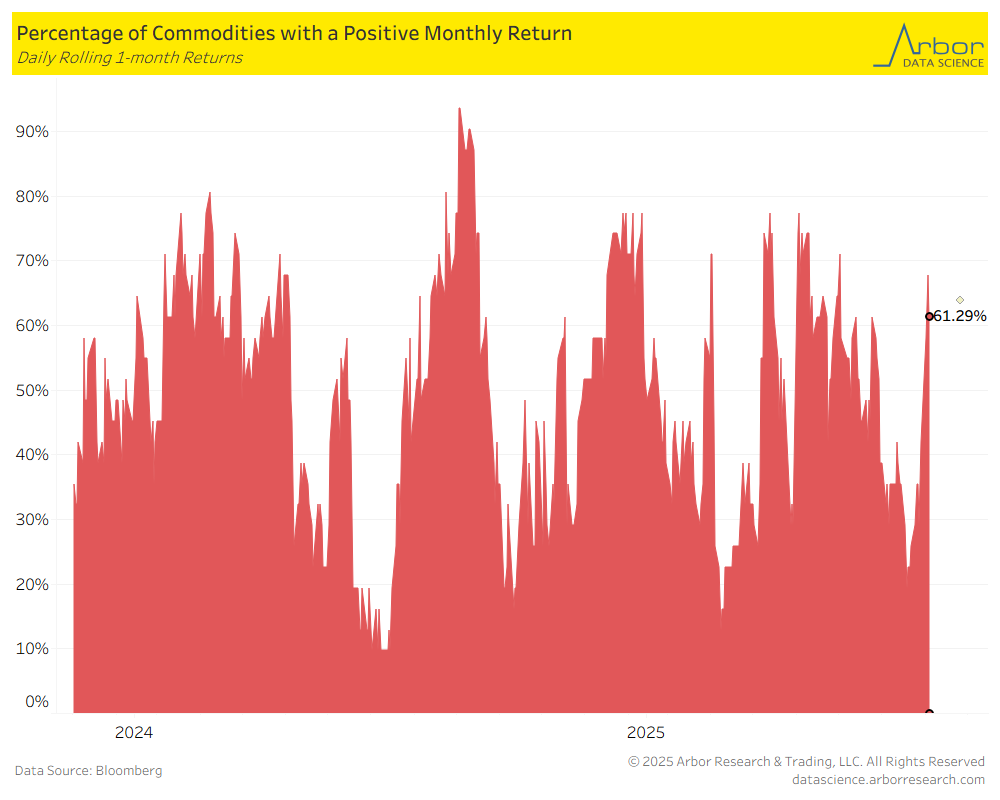
- The percentage of all commodities with a positive monthly return was 61.29% on 9/4/25, up from 29.03% the previous week (8/25/25-8/29/25).
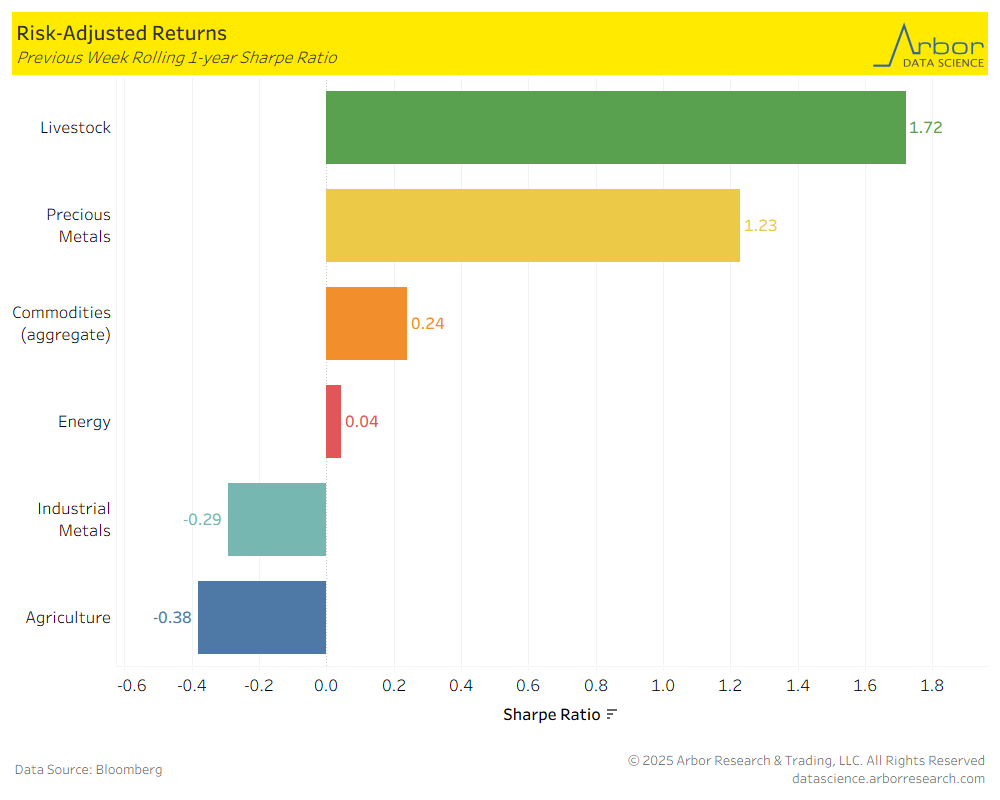
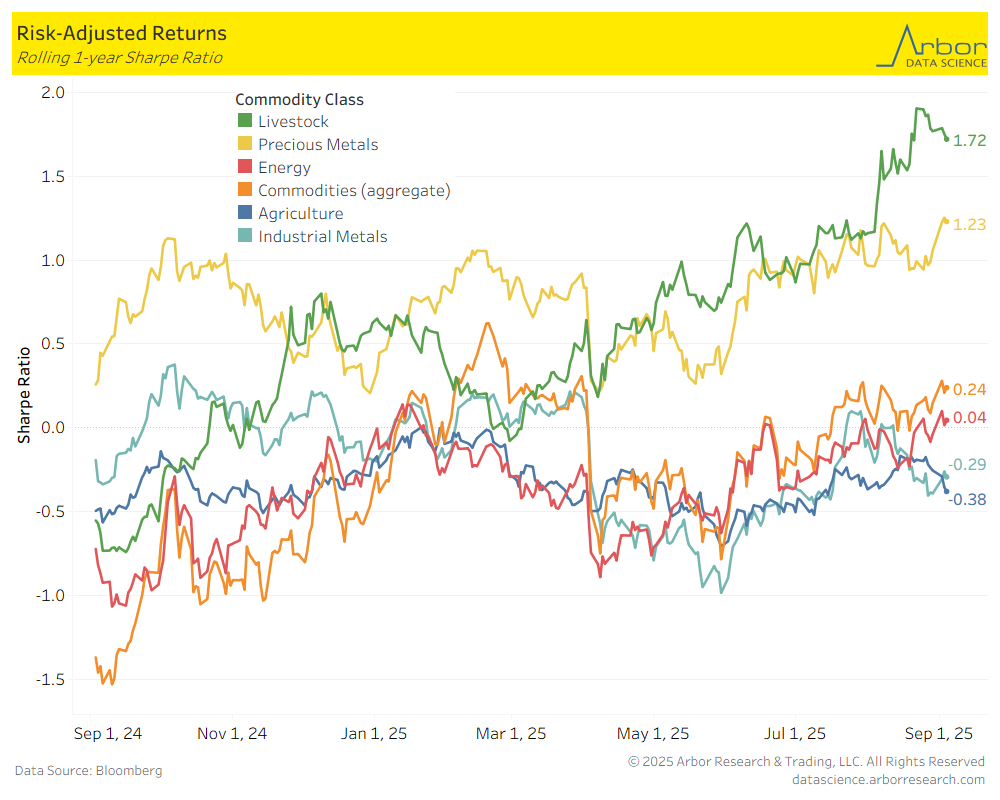
- The first chart below outlines the week-over-week (9/2/25-9/5/25) aggregate Sharpe ratio for commodities. It was 0.24 compared to 0.09 the prior week. The second chart is a rolling 1-year aggregate Sharpe ratio for commodities.
- Performance was mixed week-over-week for the asset classes shown in the chart below. The largest increase was in Precious Metals at 1.23, up from 0.95 last week.