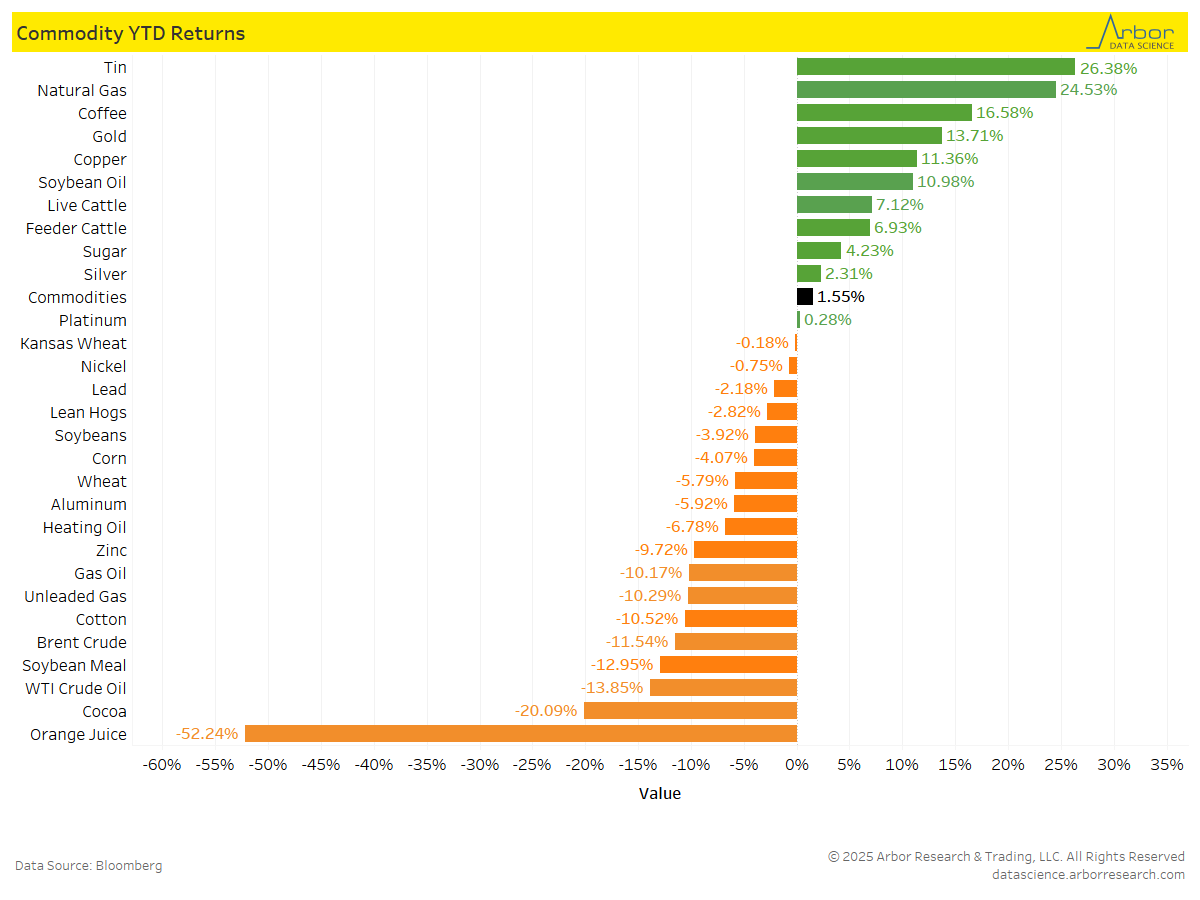
Bloomberg’s Commodity Index, which is calculated on an excess return basis and reflects commodity futures price movements, was up 1.55% on a year-to-date (YTD) basis as of 4/04/25.
YTD returns for commodities are shown in the chart below. Tin had the highest YTD return at 26.38%, followed by Natural Gas at 24.53% and Coffee at 16.58%.
Orange Juice had the largest decrease, with a YTD return of -52.24%, followed by Cocoa at -20.09%.
Soybean prices declined to $988 per bushel on 4/04/2025 as China added more tariffs on U.S. goods. China, the largest importer of soybeans, has announced reductions in purchases of U.S. crops.
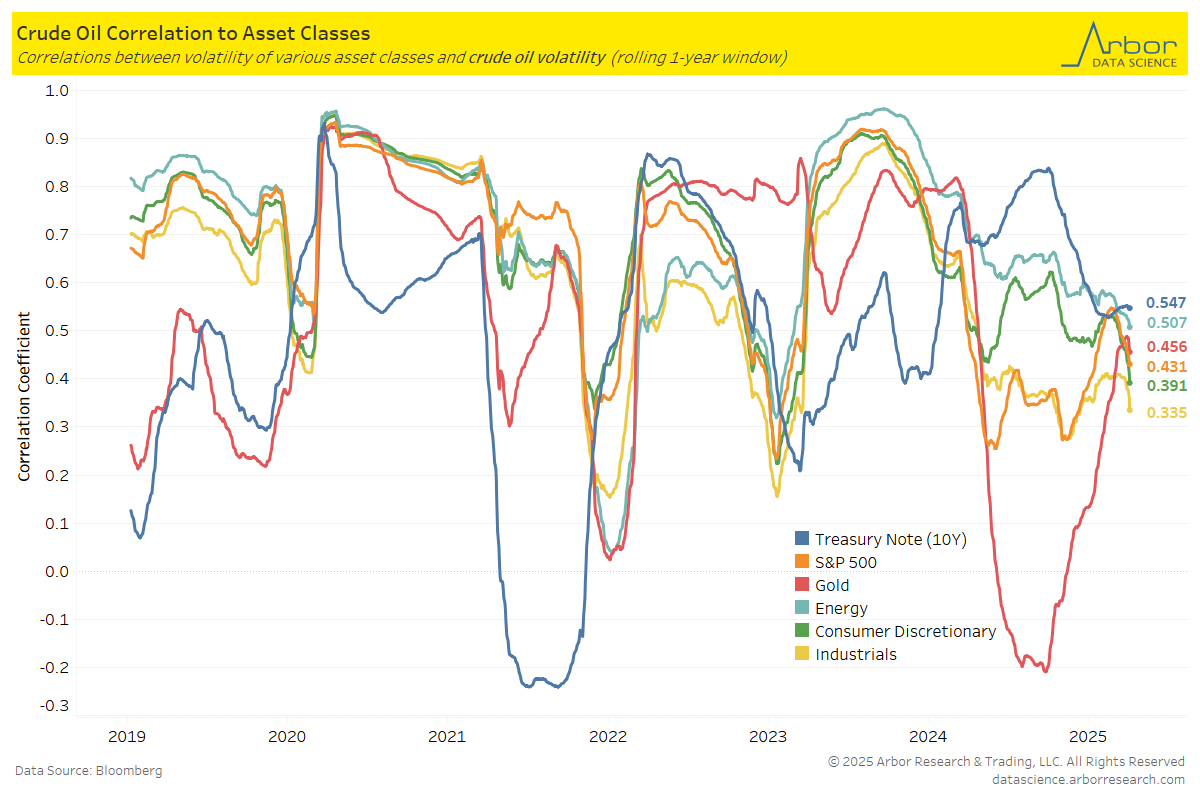
The chart below illustrates the correlations between volatility of crude oil and volatility of various asset classes.
As of 4/03/25, the 10-year Treasury Note volatility is the most correlated to crude oil volatility, with a correlation coefficient of 0.547.
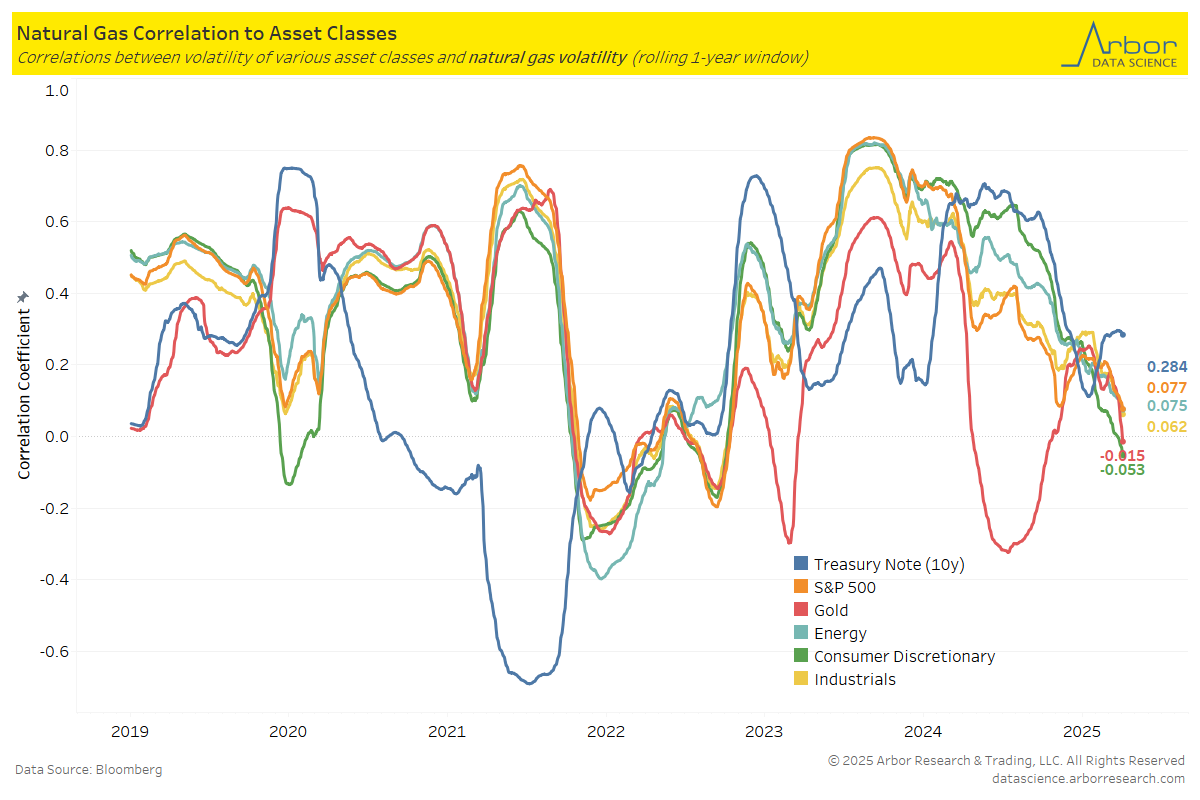
The next chart outlines the correlations between the volatility of natural gas and the volatility of various asset classes.
As of 4/03/25, the 10-year Treasury Note volatility is the most correlated to natural gas volatility, with a correlation coefficient of 0.284.
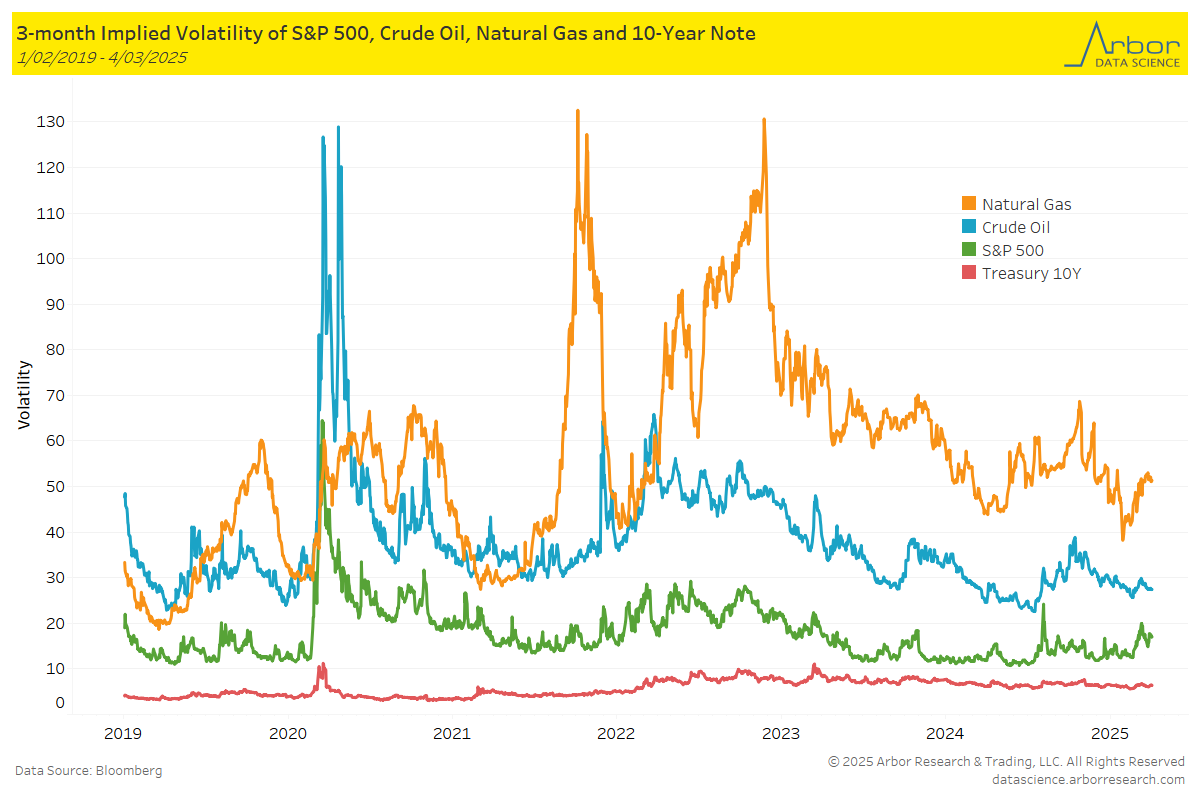
The chart below highlights the 3-month implied volatility of the S&P 500, crude oil, natural gas, and the 10-Year Note as of 4/03/25.
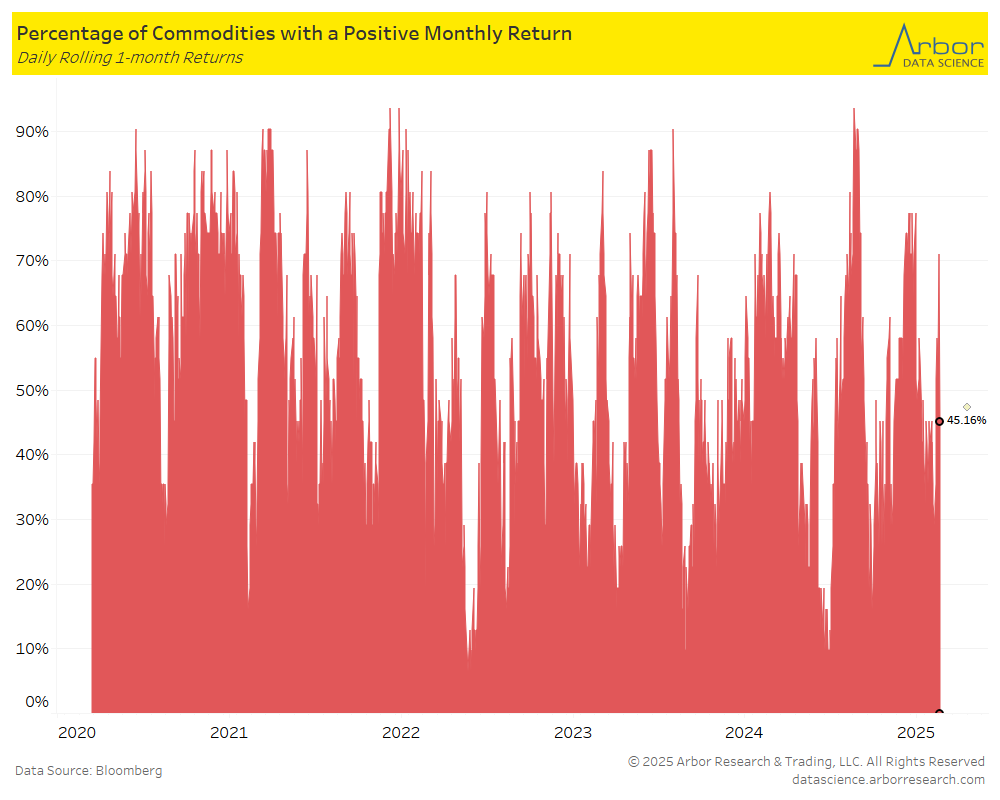
The percentage of all commodities with a positive monthly return decreased to 45.16% on 4/03/25 from 58.06% the previous week (3/24/25-3/28/25).
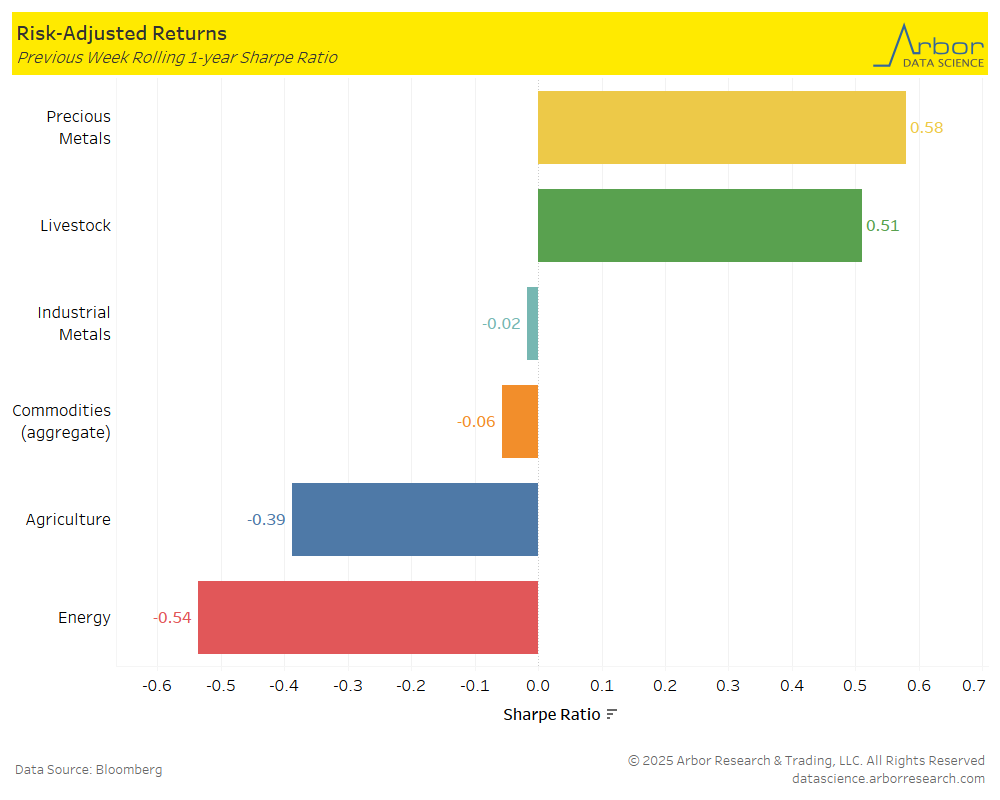
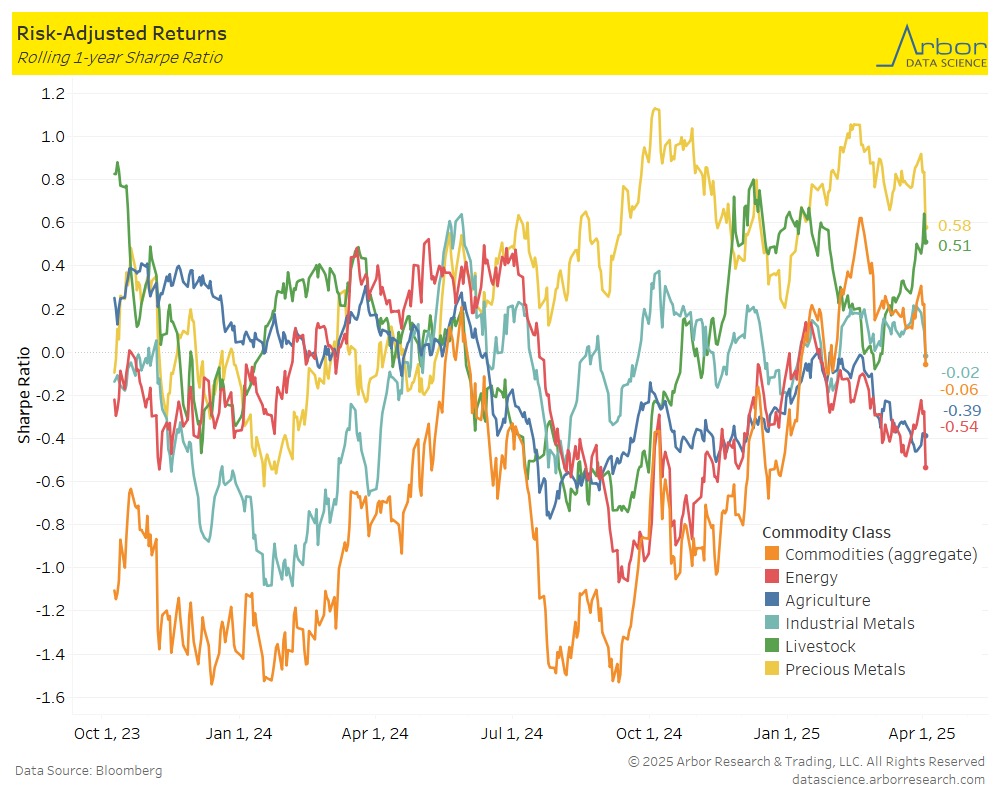
The first chart below outlines the week-over-week (3/31/25-4/04/25) aggregate Sharpe ratio for commodities. It was negative at -0.06 compared to 0.16 the prior week. The second chart is a rolling 1-year aggregate Sharpe ratio for commodities.
Performance was mixed week-over-week in all classes shown in the chart below. The largest increase was in Livestock at 0.43 from 0.31 last week. The largest decrease was in Agriculture at -0.46 from -0.32 the prior week.