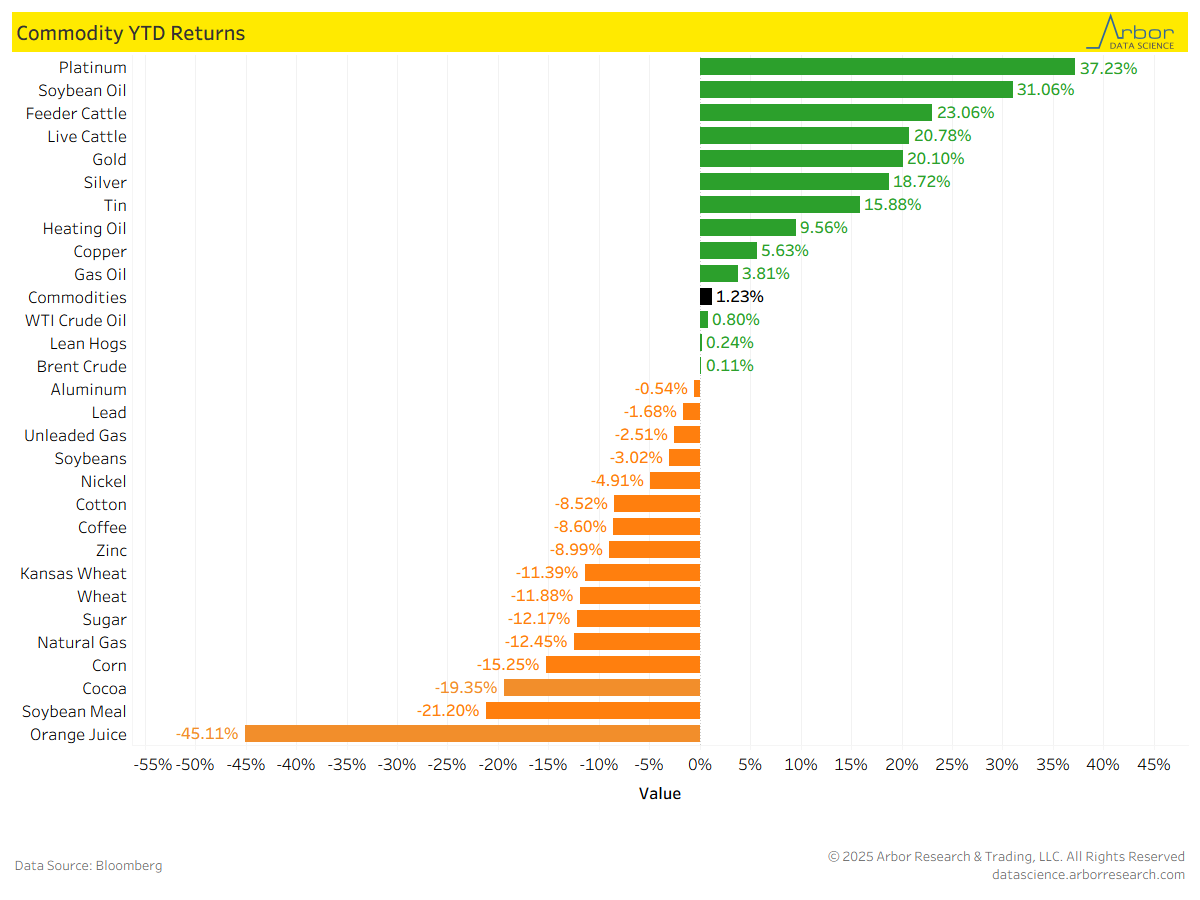
Commodity YTD Returns
- Bloomberg’s Commodity Index, which is calculated on an excess return basis and reflects commodity futures price movements, was up 1.23% on a year-to-date (YTD) basis as of 8/01/25.
- YTD returns for commodities are shown in the chart below. Platinum had the highest YTD return at 37.23%, followed by Copper at 31.06% and Soybean Oil at 23.06%.
- Orange Juice had the largest decrease, with a YTD return of -45.11%, followed by Soybean Meal at -21.20%.
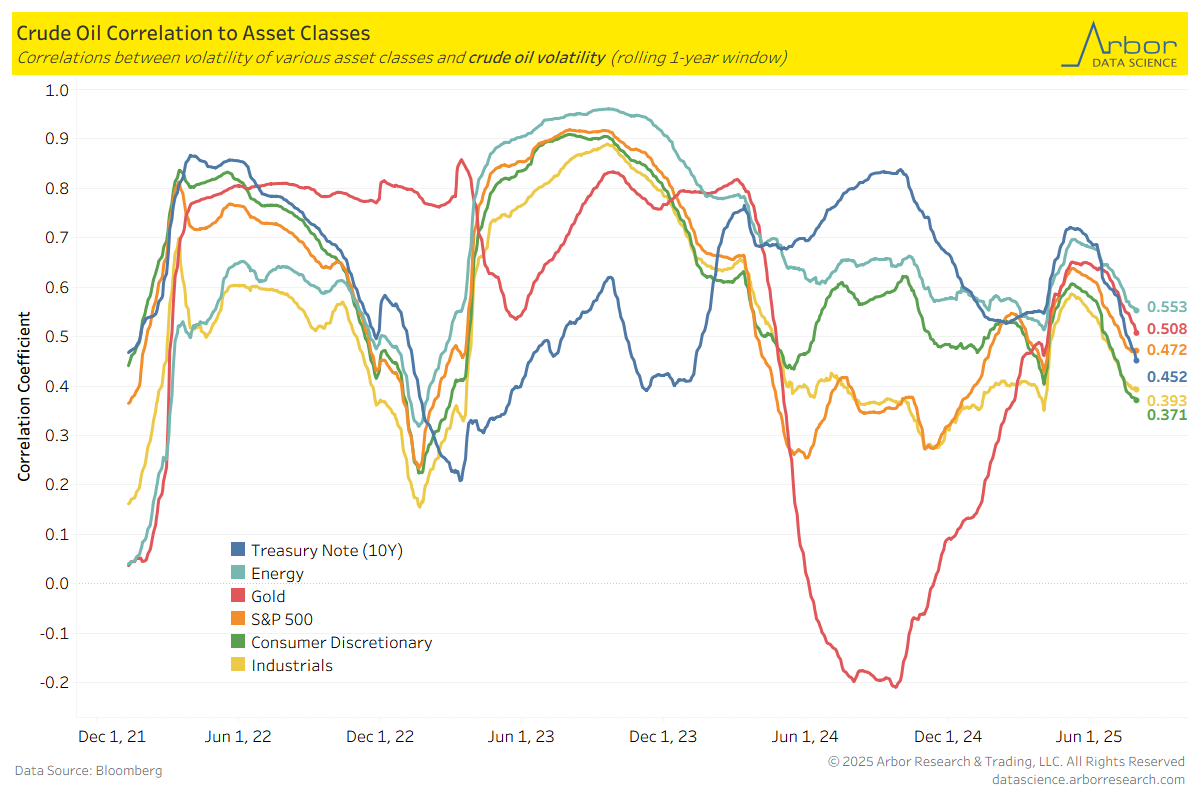
- The chart below illustrates the correlations between volatility of crude oil and volatility of various asset classes.
- As of 7/31/25, the Energy asset class is the most correlated to crude oil volatility, with a correlation coefficient of 0.553.
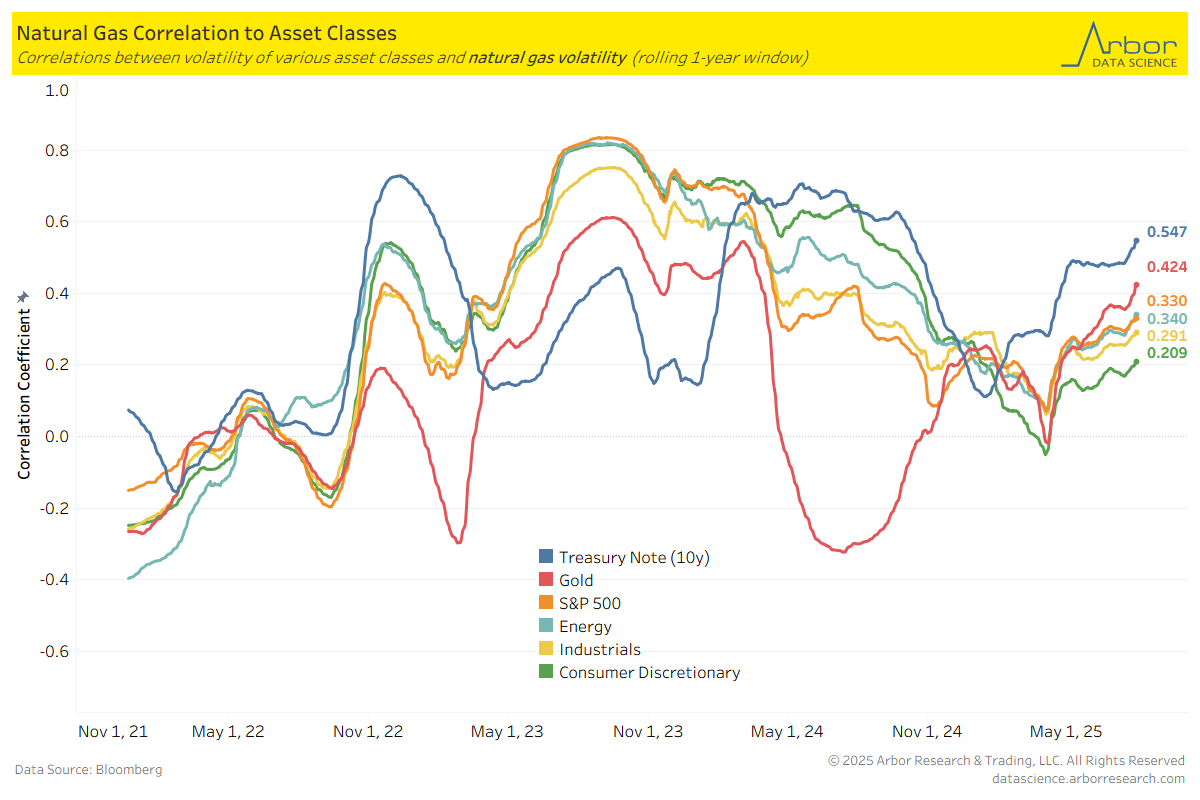
- The next chart outlines the correlations between the volatility of natural gas and the volatility of various asset classes.
- As of 7/31/25, the 10-year Treasury Note volatility is the most correlated to natural gas volatility, with a correlation coefficient of 0.547.
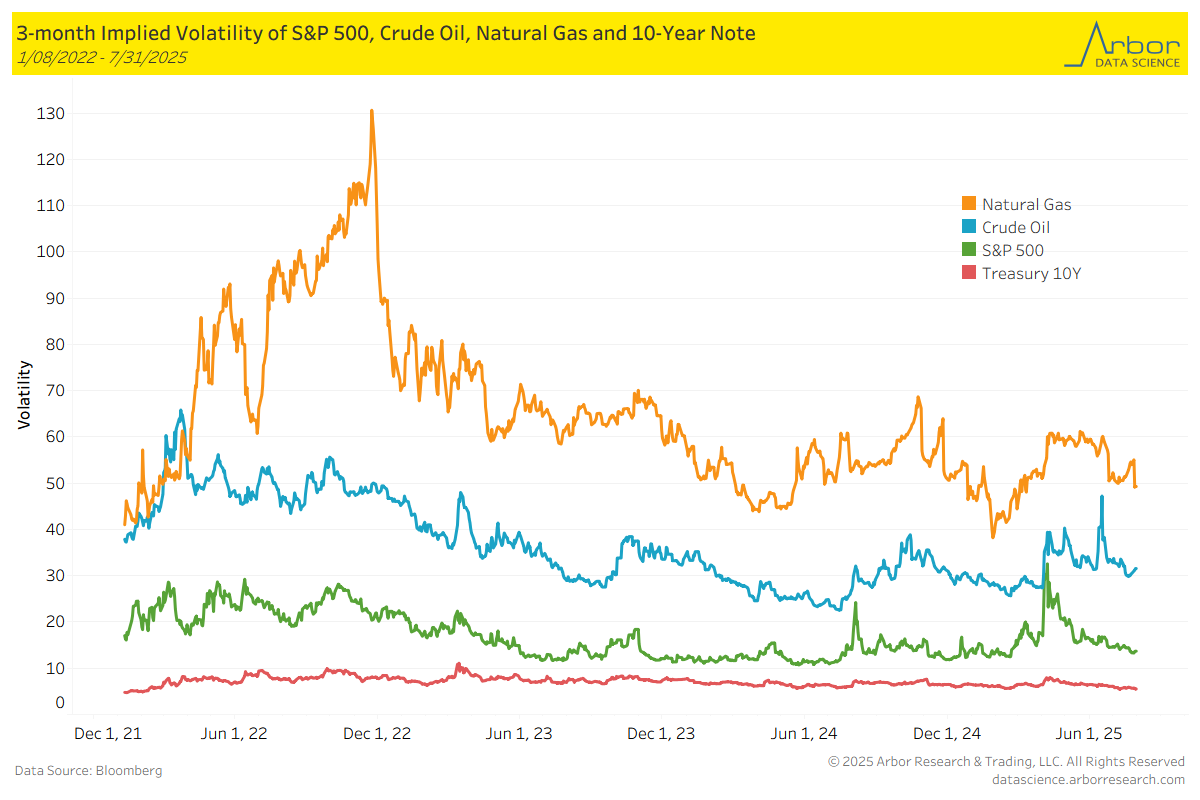
- The chart below highlights the 3-month implied volatility of the S&P 500, crude oil, natural gas, and the 10-Year Note as of 7/31/25.
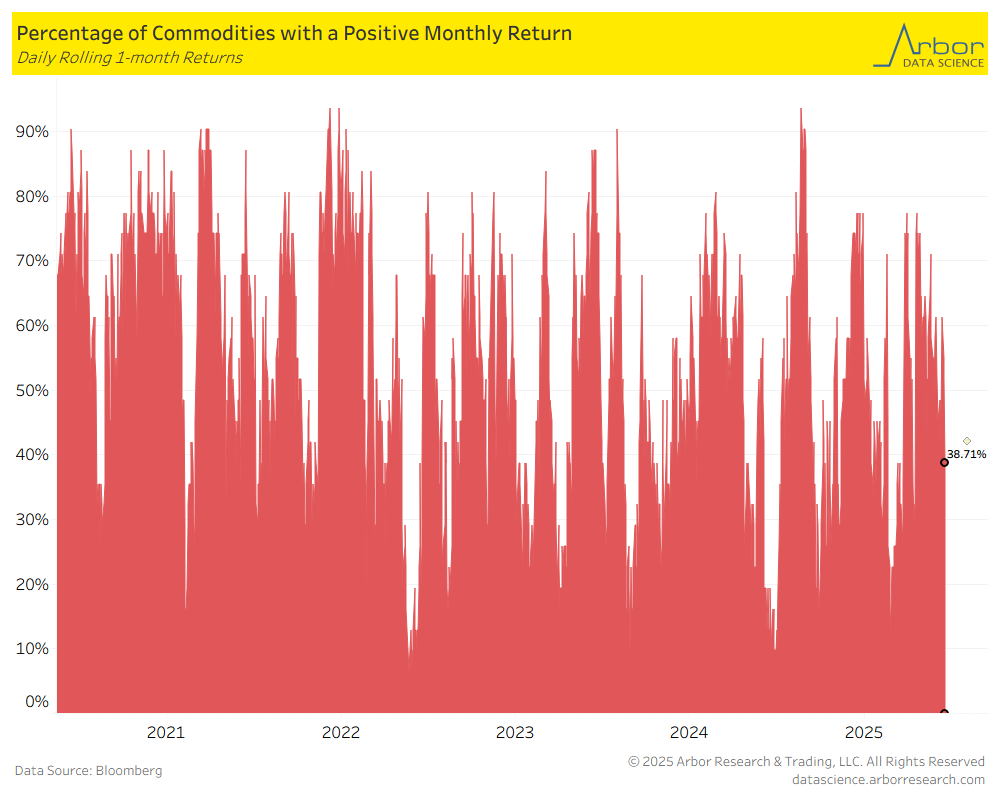
- The percentage of all commodities with a positive monthly return was 38.71% on 7/31/25, down from 45.16% from the previous week (7/21/25-7/25/25).
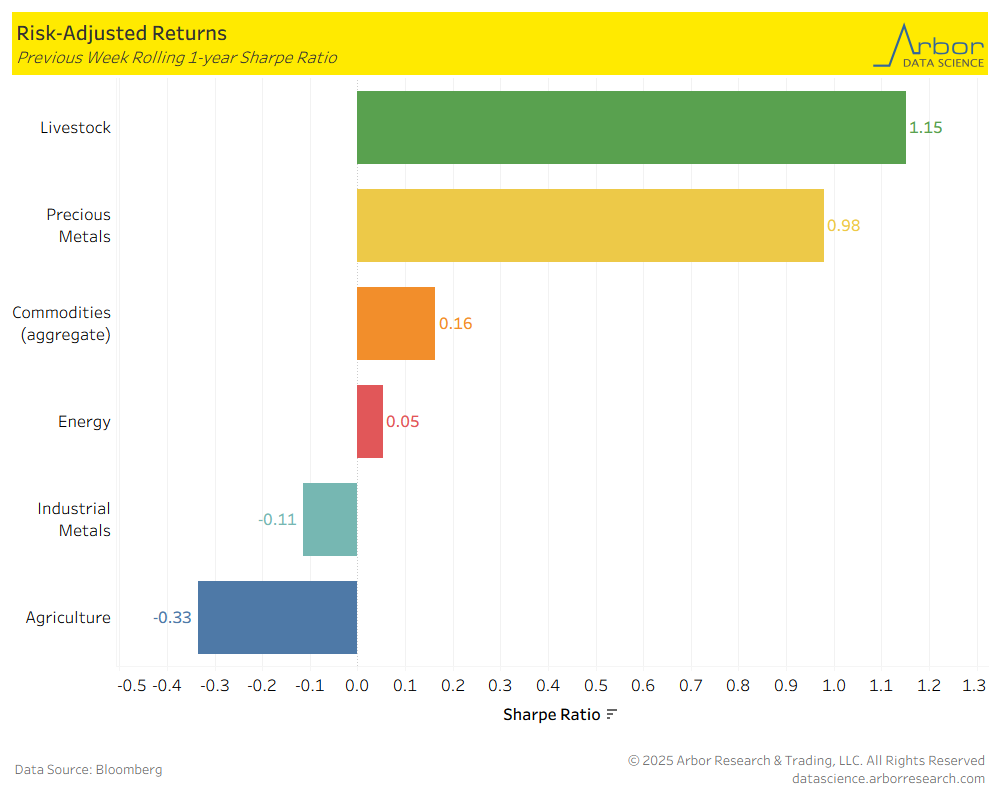
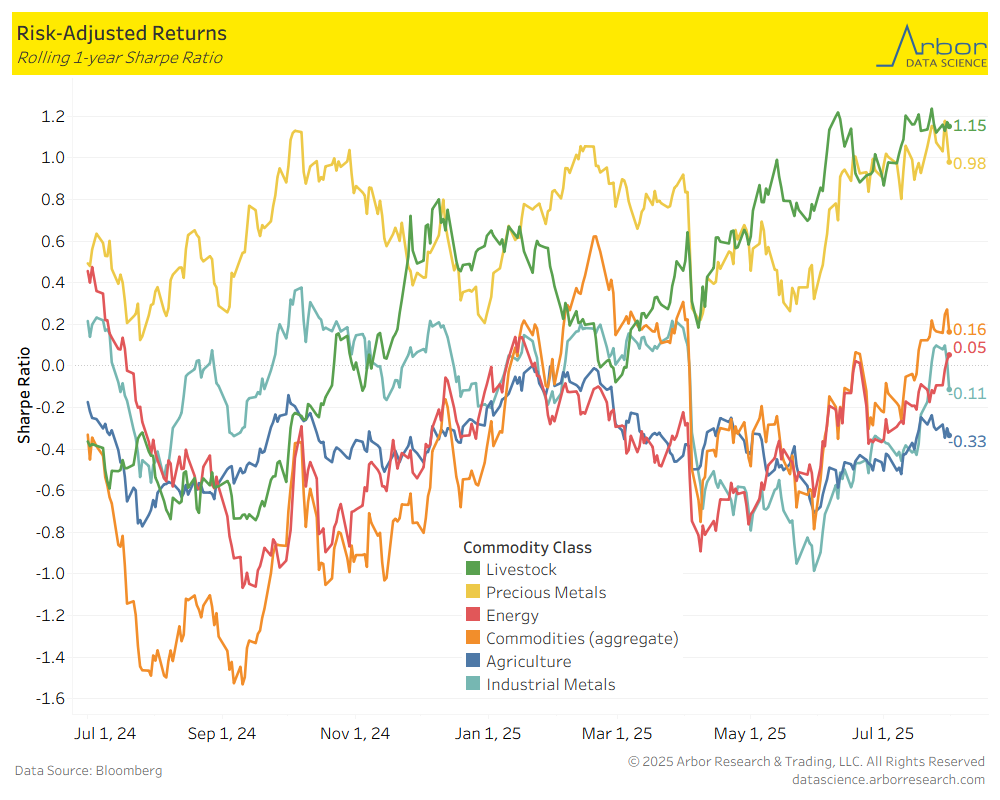
- The first chart below outlines the week-over-week (7/28/25-8/01/25) aggregate Sharpe ratio for commodities. It was 0.16 compared to 0.18 the prior week. The second chart is a rolling 1-year aggregate Sharpe ratio for commodities.
- Performance mostly decreased week-over-week for the asset classes shown in the chart below. The largest decrease was in Precious Metals at 0.98, down from 1.15 last week.