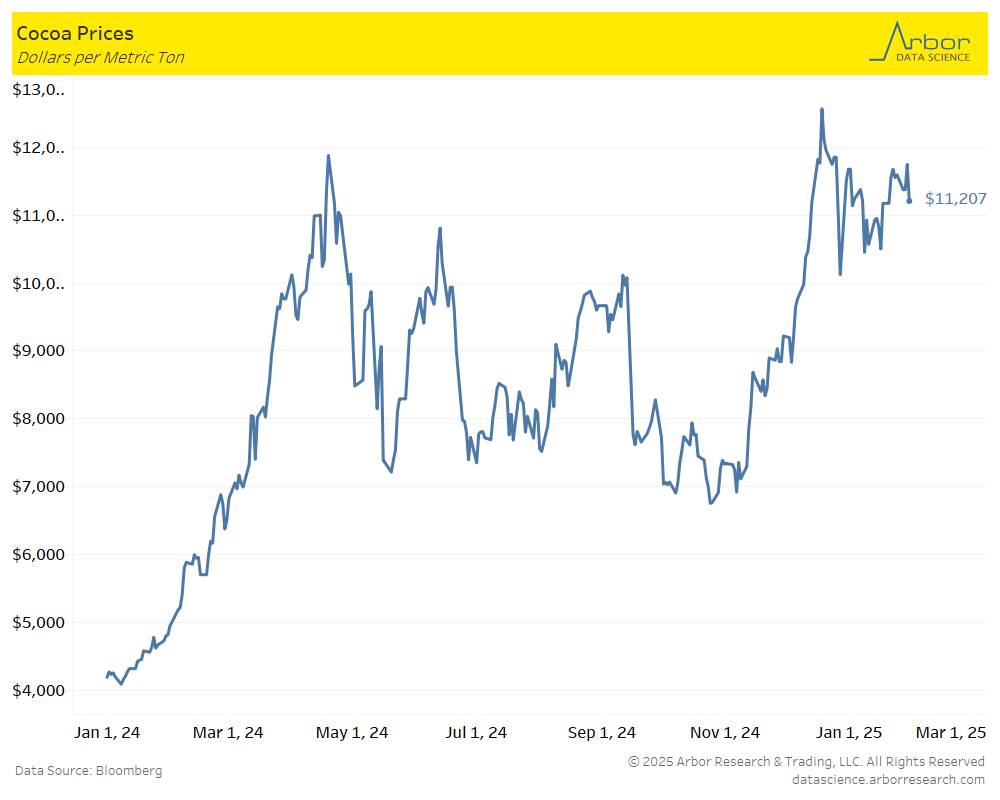
As of 1/30/25, the price of cocoa was at $11,207 per metric ton, a decrease from last week’s price of $11,552 per metric ton, for a -2.99% week-over-week decrease. Cocoa prices were impacted by dry conditions in West Africa. Cocoa continues to have fears of a supply shortage.
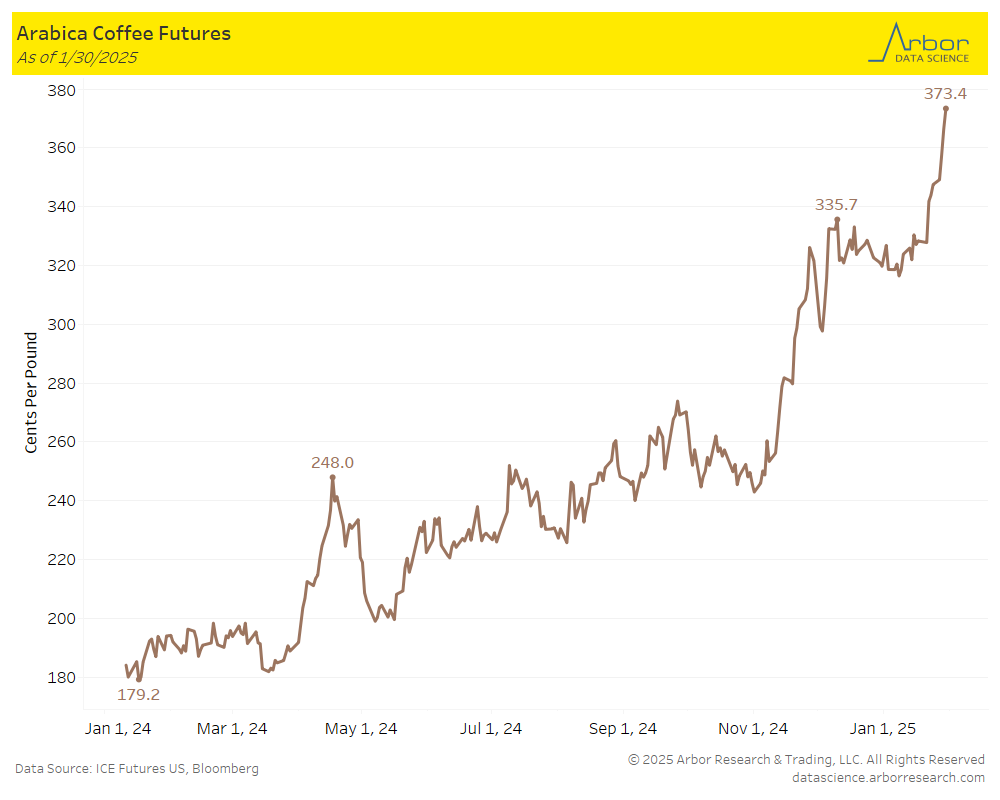
Arabica Coffee prices continue to climb, hitting a peak of 373.4 cents per pound on 1/30/25 compared to 321.0, only one month ago on 12/30/24.
Coffee prices have been negatively impacted by growing conditions in Brazil where a severe drought this past summer devastated the harvest.
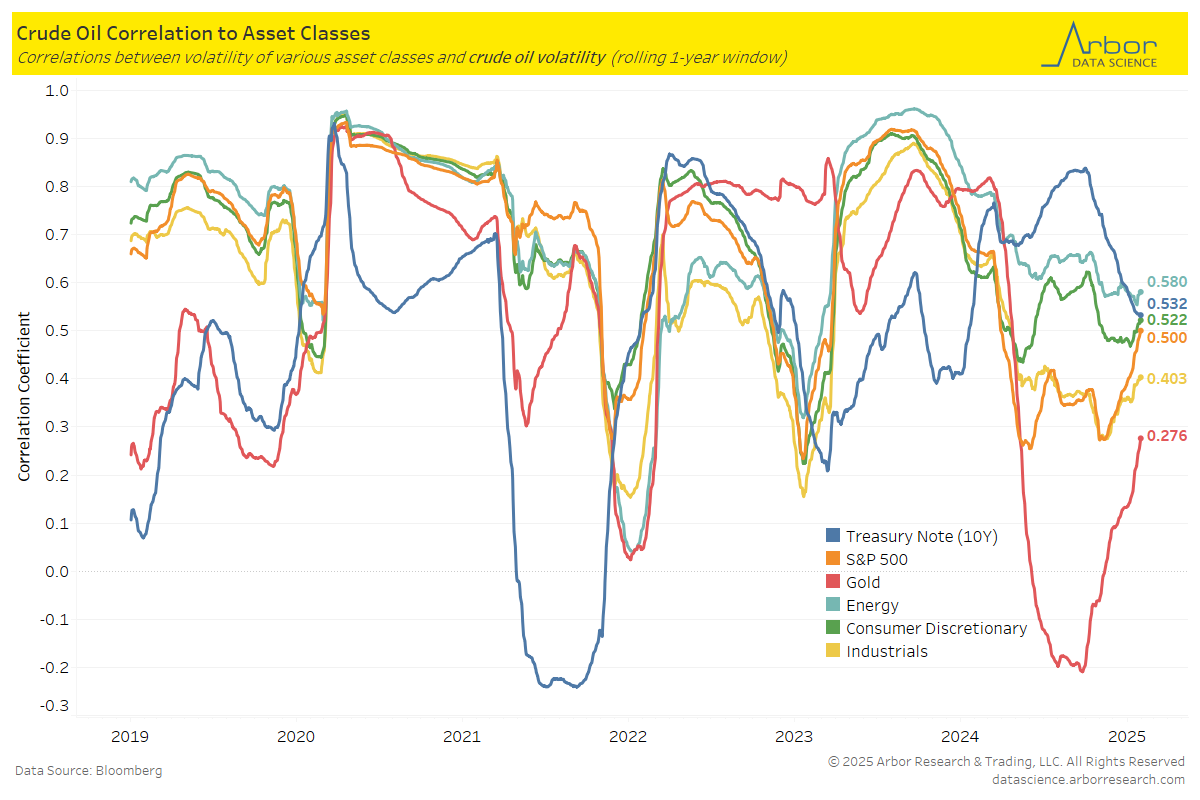
The chart below illustrates the correlations between volatility of crude oil and volatility of various asset classes.
As of 1/30/25, the 10-year Treasury Note volatility is most correlated to crude oil volatility, with a correlation coefficient of 0.532.
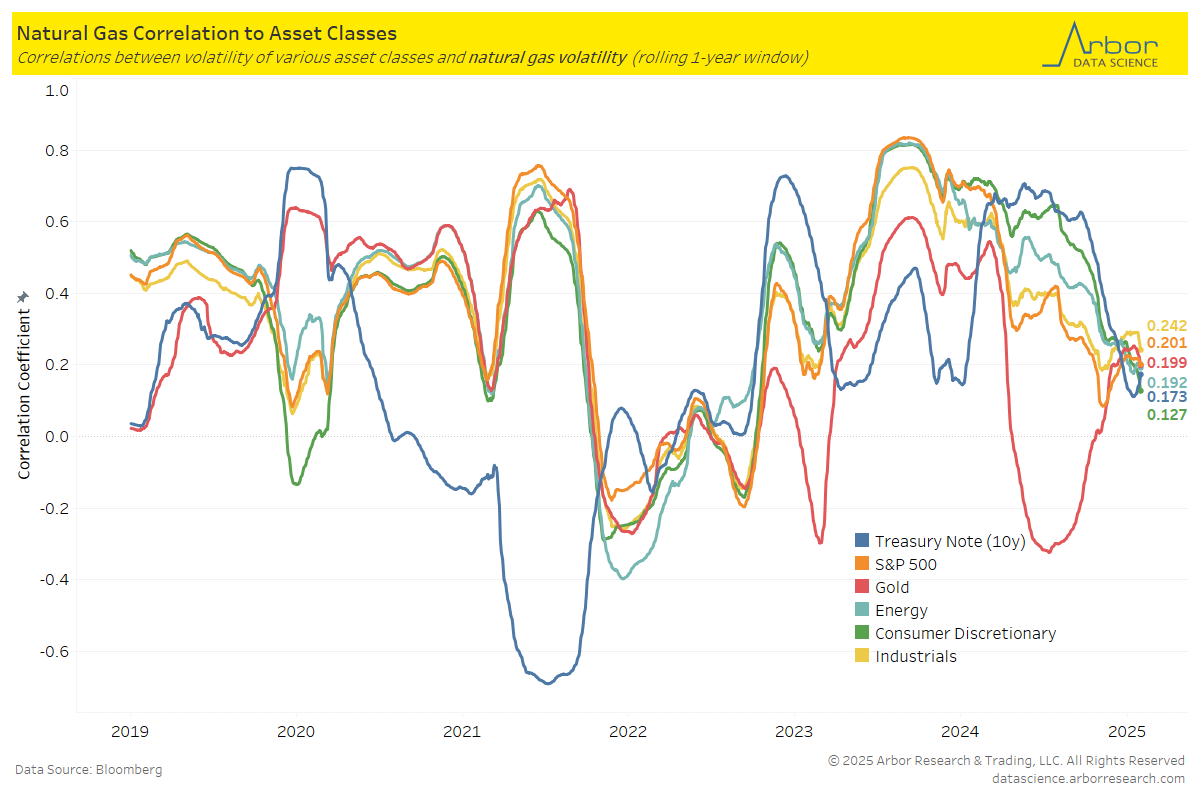
The next chart outlines the correlations between the volatility of natural gas and the volatility of various asset classes.
As of 1/30/25, the 10-year Treasury Note volatility is most correlated to natural gas volatility, with a correlation coefficient of 0.173.
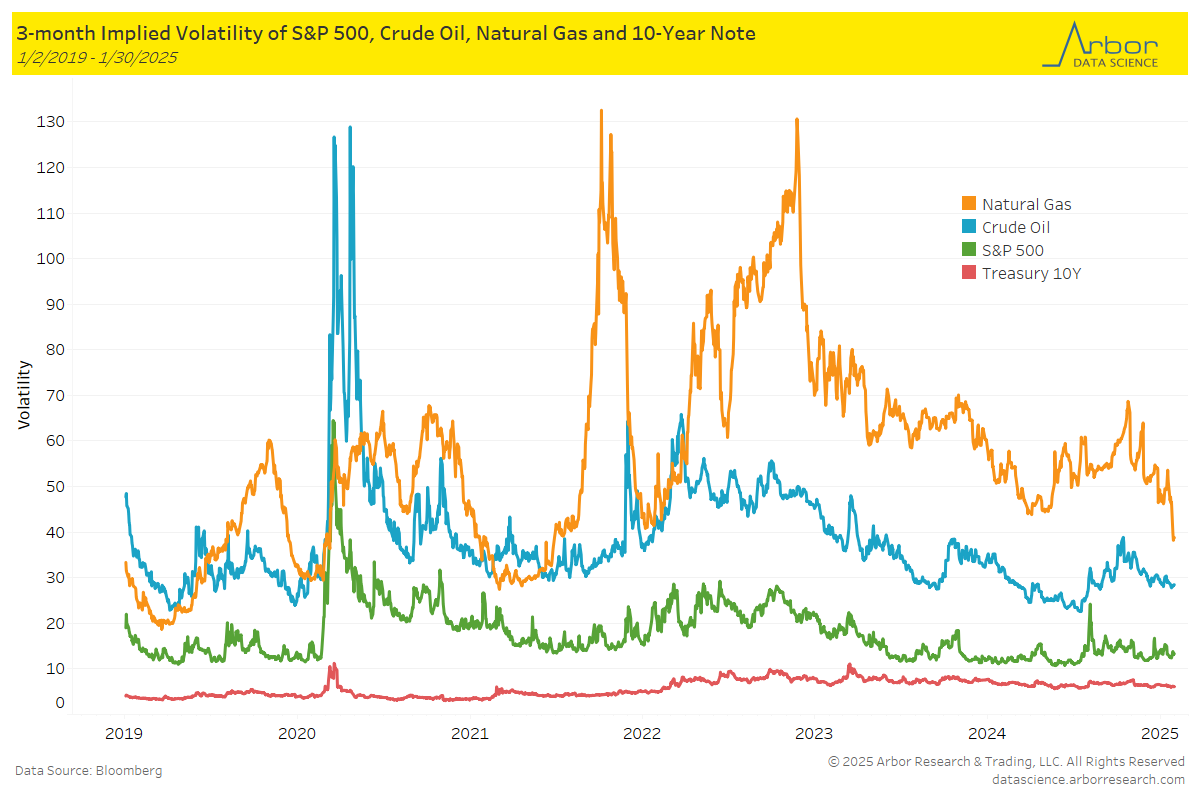
The chart below highlights the 3-month implied volatility of the S&P 500, crude oil, natural gas, and the 10-Year Note as of 1/30/25.
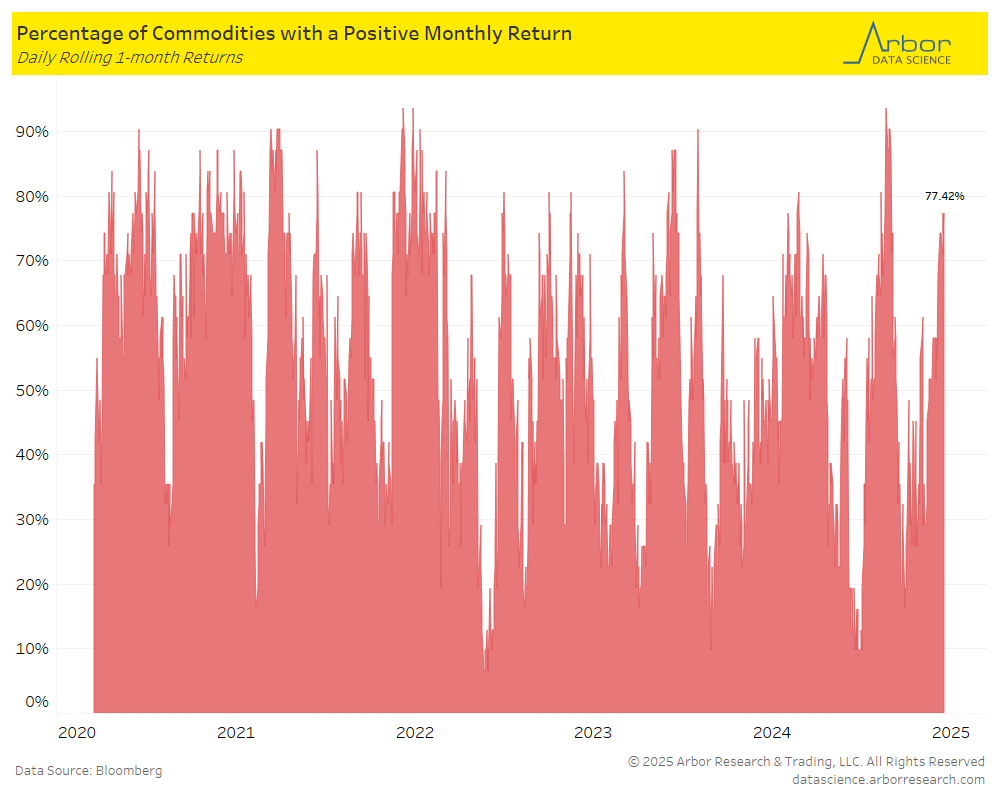
The percentage of all commodities with a positive monthly return increased to 77.42% on 1/30/25 from 74.19% the previous week (1/20/25-1/24/25).
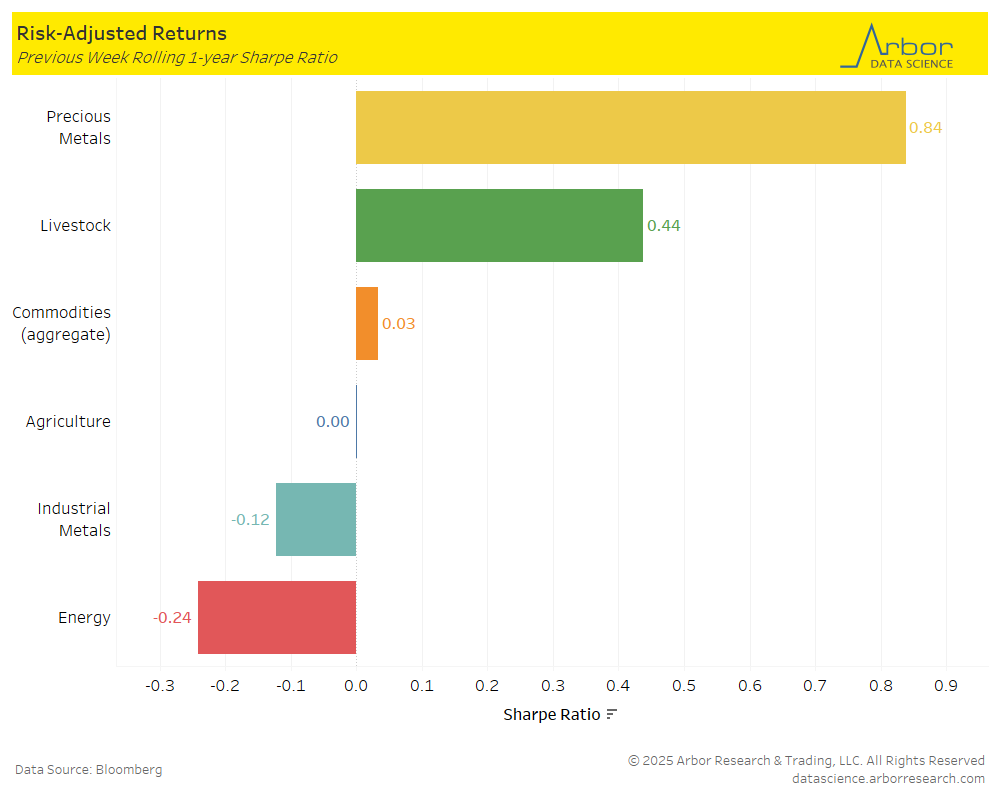
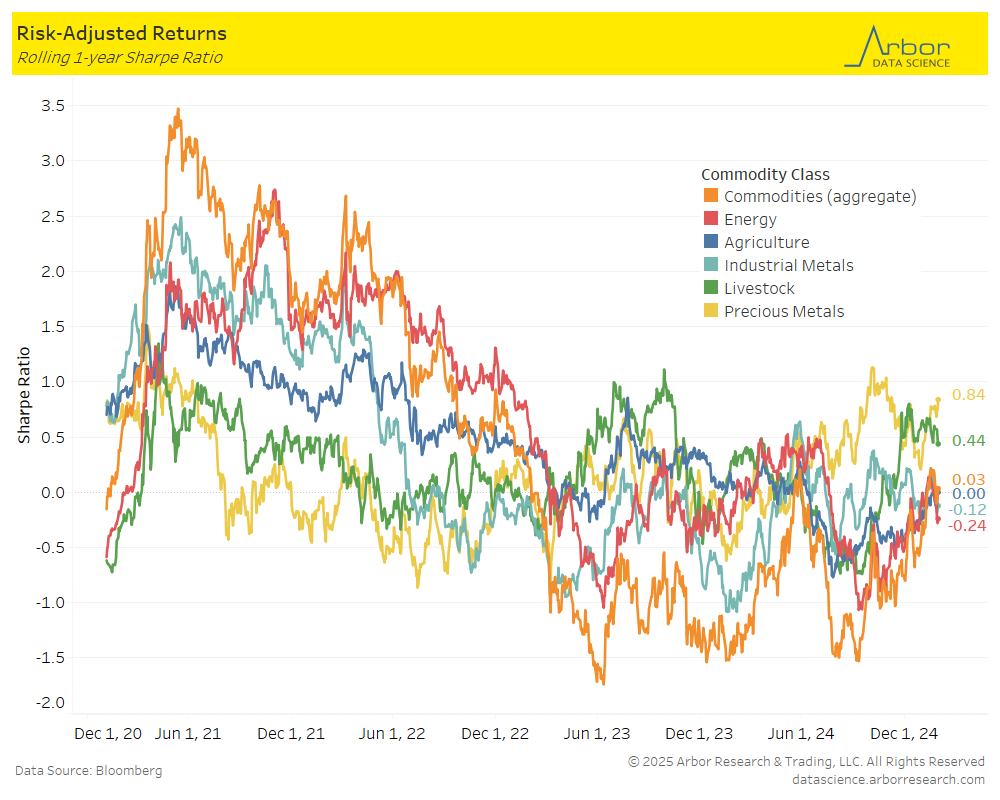
The first chart below outlines the week-over-week (1/27/25-1/31/25) aggregate Sharpe ratio for commodities. It was positive at 0.03 compared to 0.18 to the prior week. The second chart is a rolling 1-year aggregate Sharpe ratio for commodities.
Performance was mostly positive week-over-week in all classes, except Industrial Metals and Energy, shown in the chart below, with the largest increase in Precious Metals at 0.84 from 0.77 the prior week.