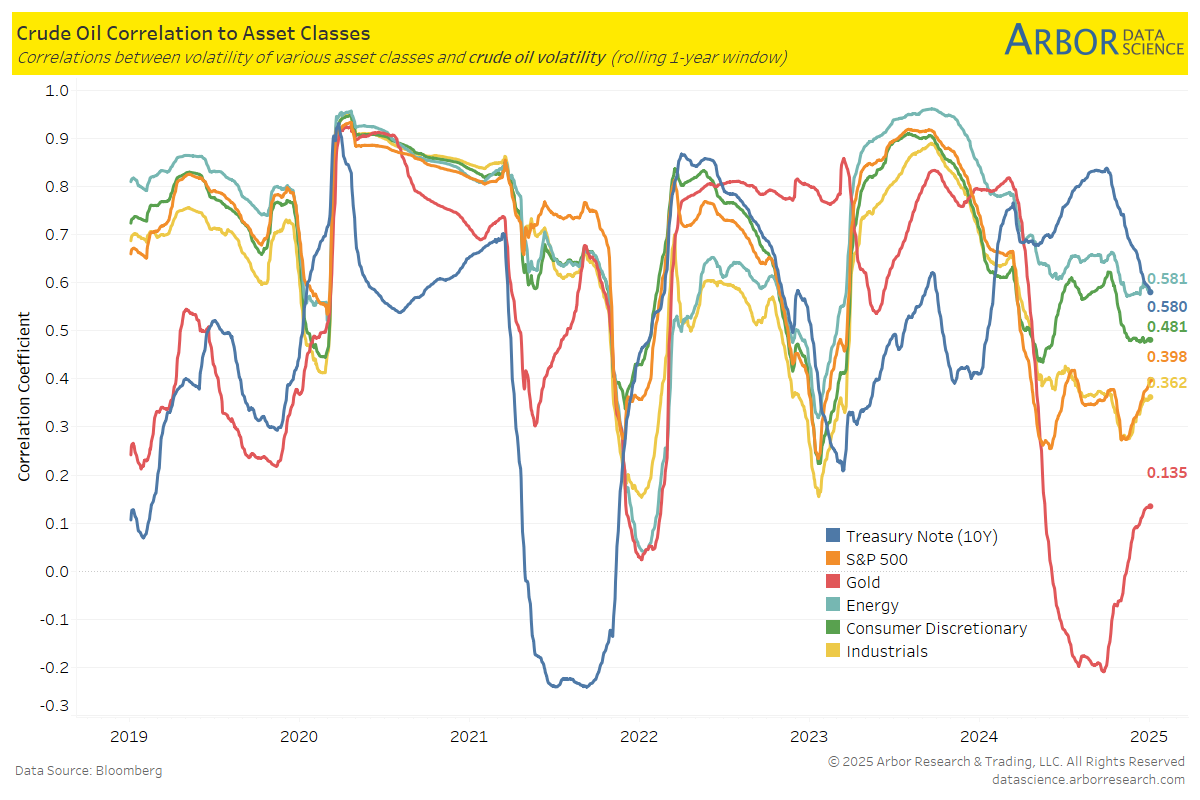
- The chart below illustrates the correlations between volatility of crude oil and volatility of various asset classes.
- As of 01/02/25, the 10-year Treasury Note volatility is the most correlated to crude oil volatility, with a correlation coefficient of 0.580.
-
-
-
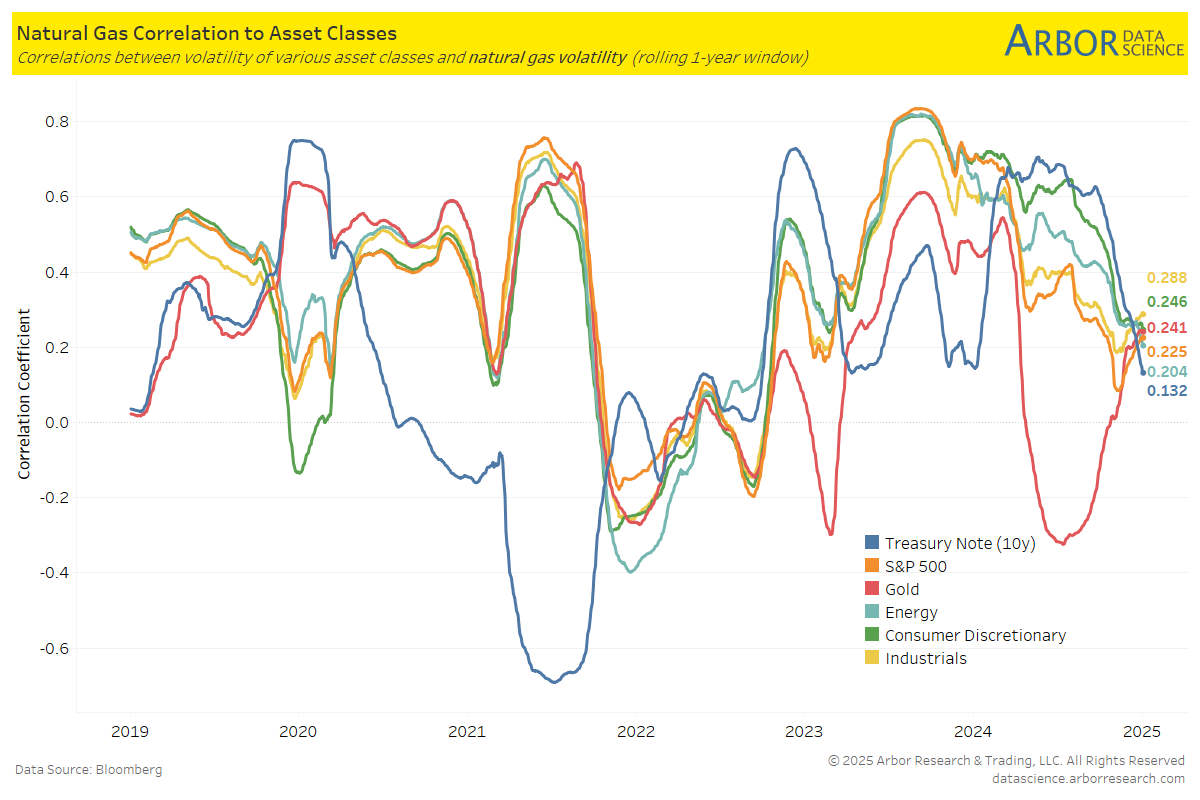
- The next chart outlines the correlations between the volatility of natural gas and the volatility of various asset classes.
- As of 01/02/25, the 10-year Treasury Note volatility is the most correlated to natural gas volatility, with a correlation coefficient of 0.158.
-
-
-
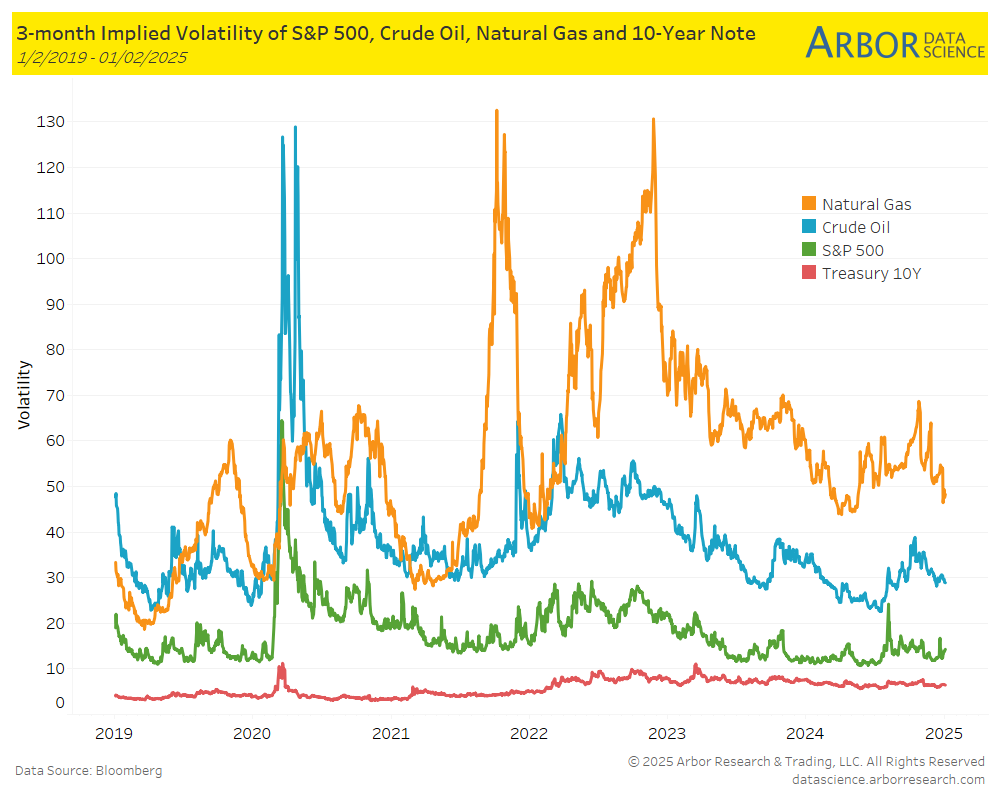
- The chart below highlights the 3-month implied volatility of the S&P 500, crude oil, natural gas, and the 10-Year Note as of 01/02/25.
-
-
-
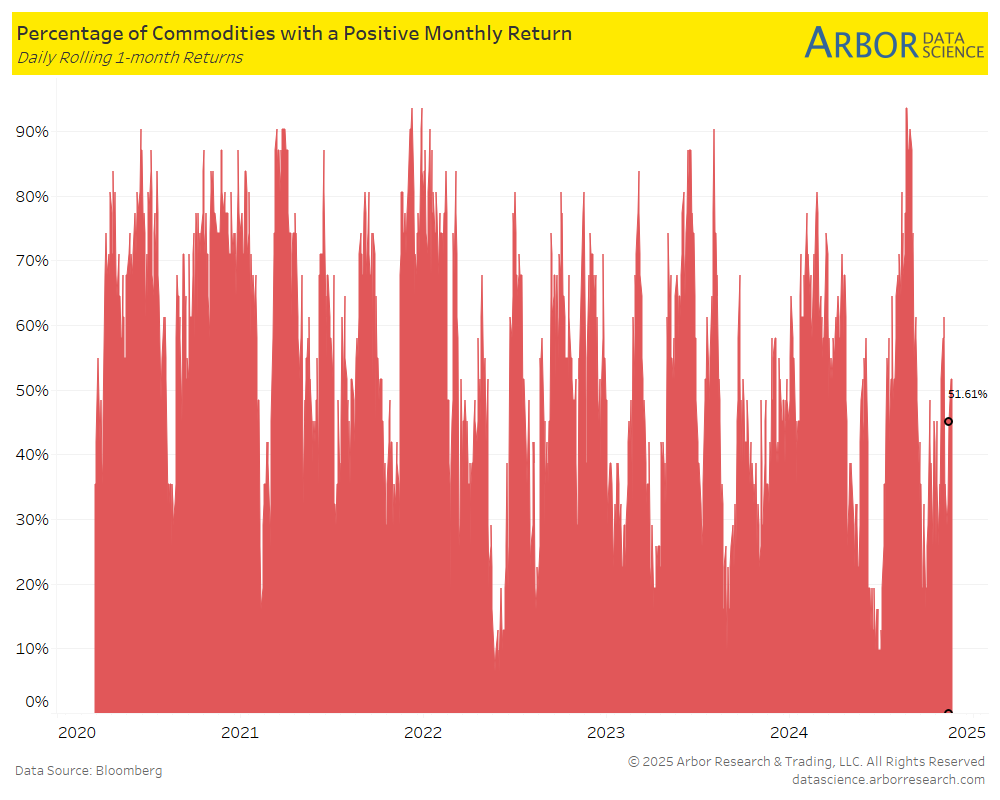
- The percentage of all commodities with a positive monthly return increased to 51.61% on 01/02/25 from 45.16% the previous week (12/23/24-12/27/24).
-
-
-
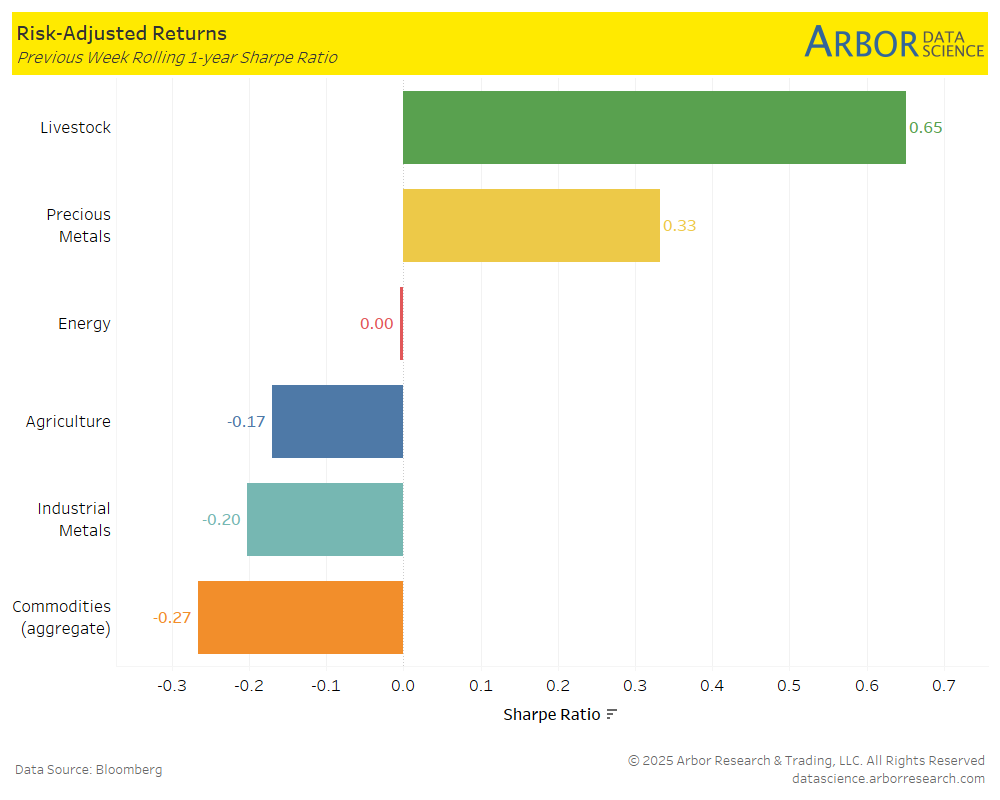
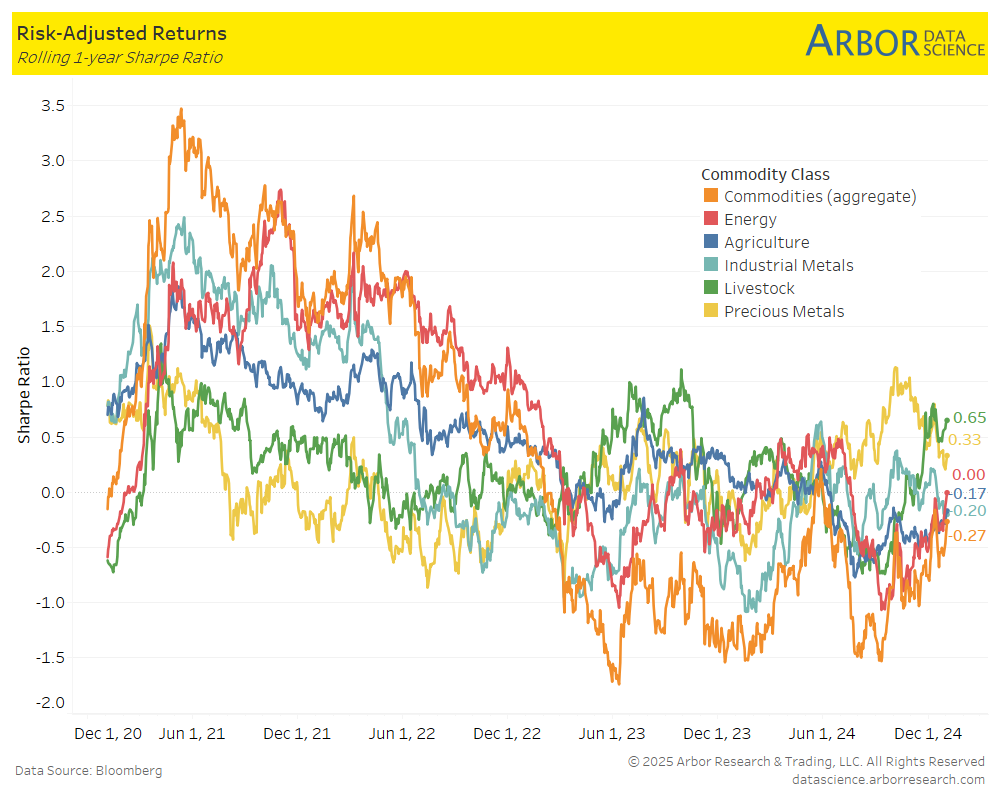
- The first chart below outlines the week-over-week (12/30/24-01/02/24) aggregate Sharpe ratio for commodities. It was negative at -0.27 compared to -0.57 the prior week. The second chart is a rolling 1-year aggregate Sharpe ratio for commodities.
- Performance mostly increased week-over-week in all classes shown in the chart below, with the largest increase in Livestock at 0.65 from 0.56 the prior week.
-