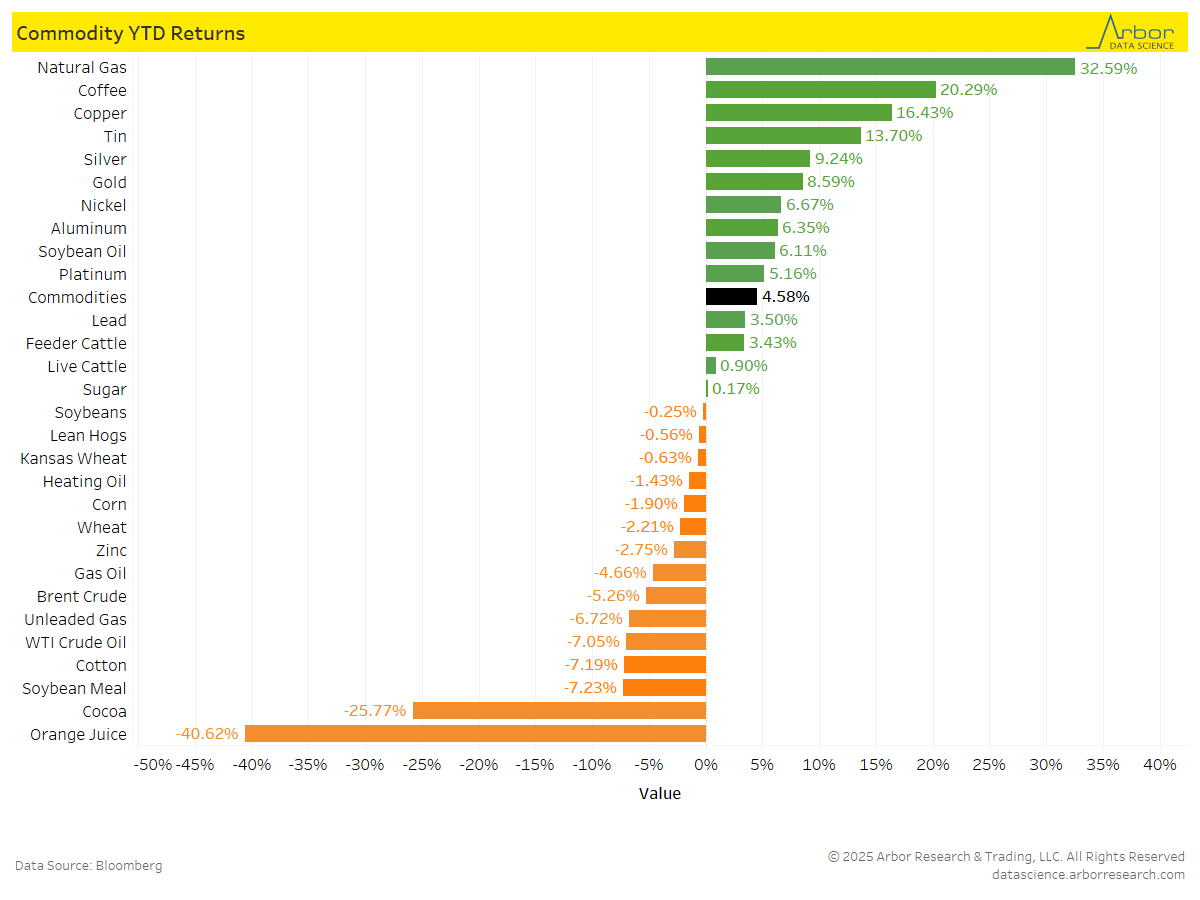
Bloomberg’s Commodity Index, which is calculated on an excess return basis and reflects commodity futures price movements, was up 4.58% on a year-to-date (YTD) basis as of 3/7/25.
YTD returns for commodities are shown in the chart below. Natural Gas had the highest YTD return at 32.59%, followed by Coffee at 20.29% and Copper at 16.43%. Orange Juice had the largest decrease, with a YTD return of –40.62%, followed by Cocoa at -25.77%.
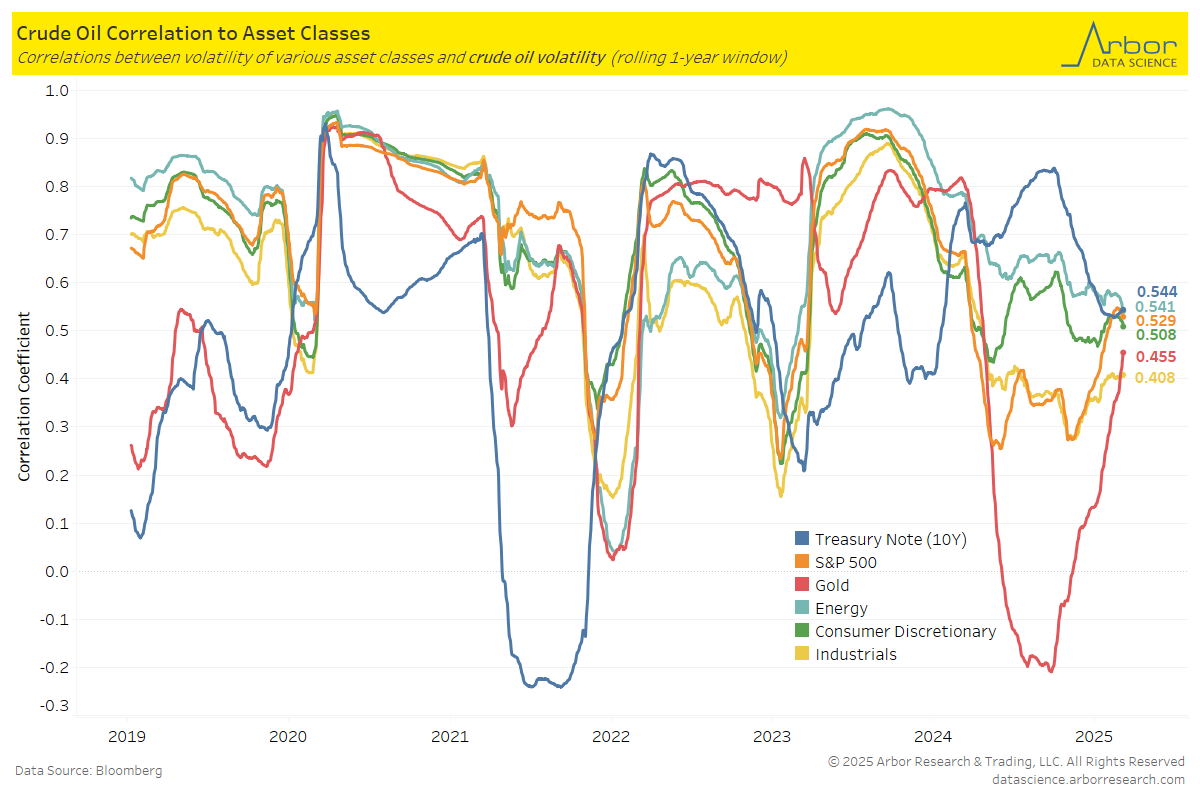
The chart below illustrates the correlations between volatility of crude oil and volatility of various asset classes.
As of 3/6/25, the 10-year Treasury Note volatility is the most correlated to crude oil volatility, with a correlation coefficient of 0.544.
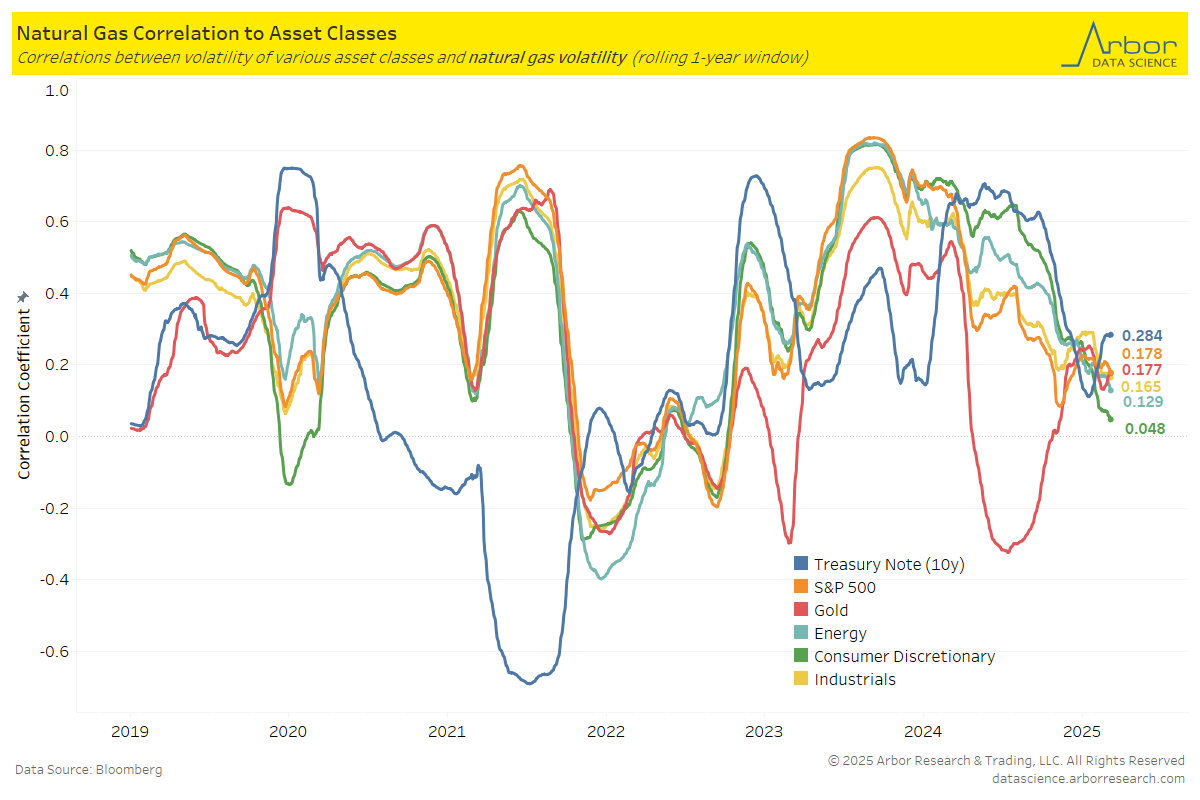
The next chart outlines the correlations between the volatility of natural gas and the volatility of various asset classes.
As of 3/6/25, the 10-year Treasury Note volatility is the most correlated to natural gas volatility, with a correlation coefficient of 0.284.
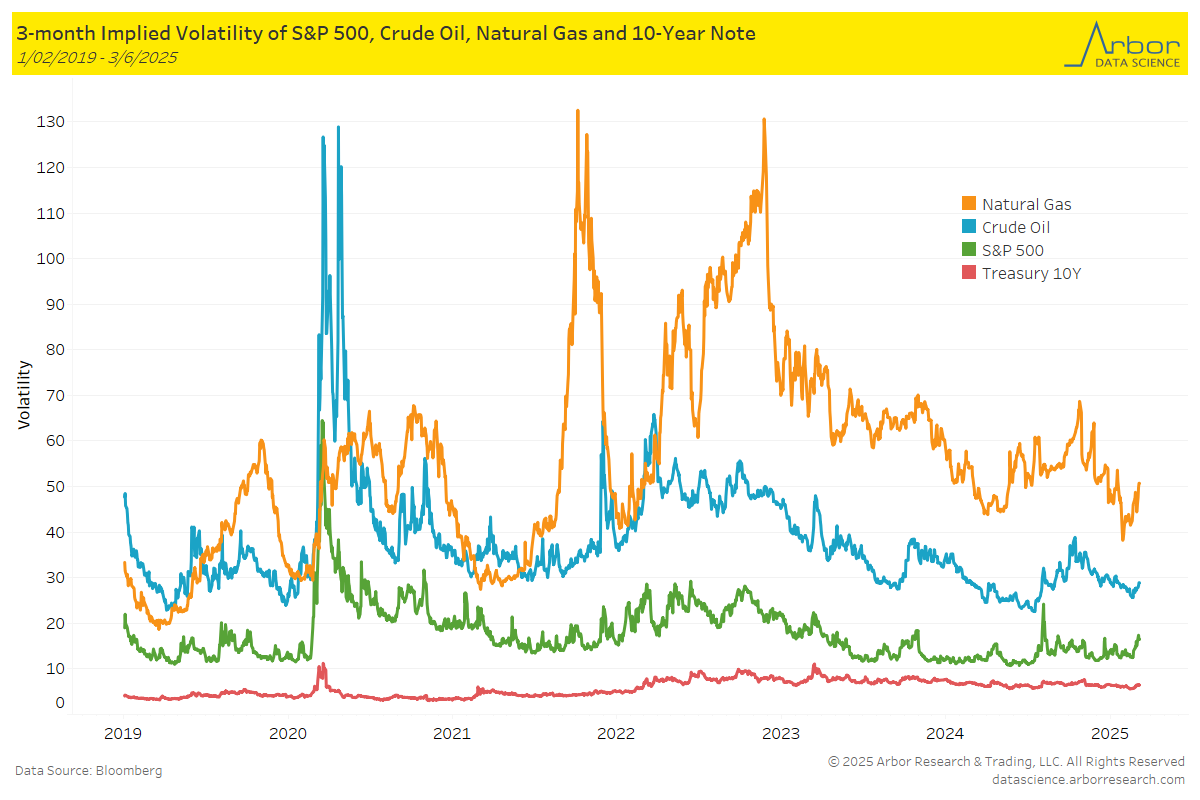
The chart below highlights the 3-month implied volatility of the S&P 500, crude oil, natural gas, and the 10-Year Note as of 3/6/25.
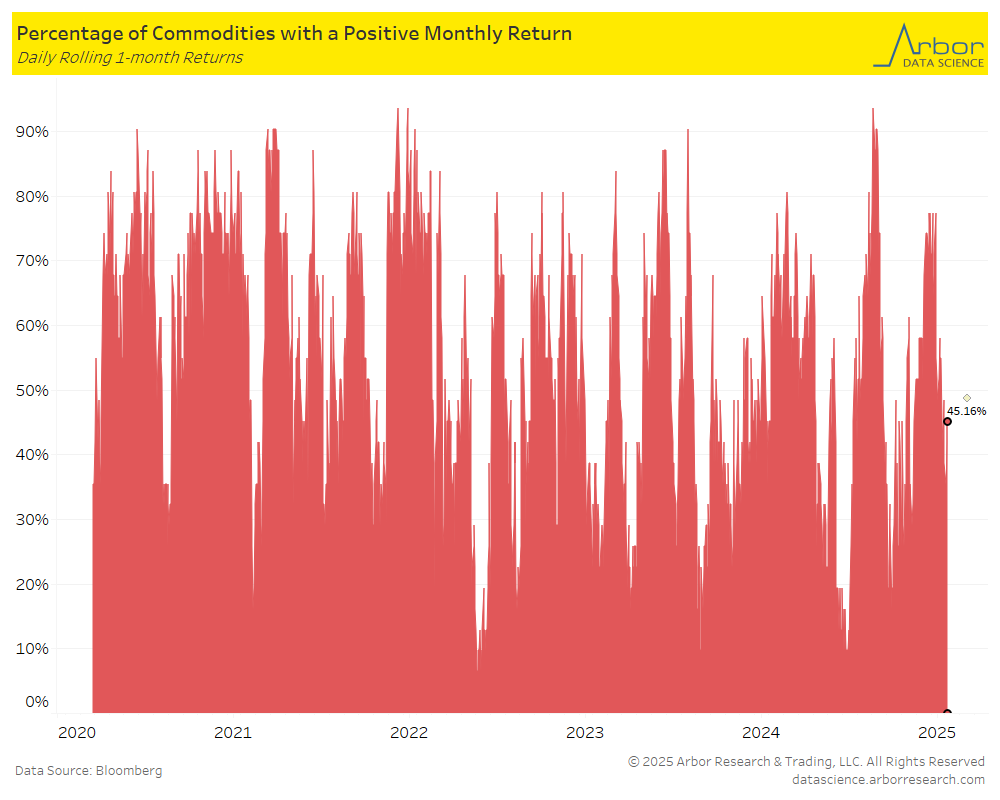
The percentage of all commodities with a positive monthly return decreased to 45.16% on 3/6/25 from 48.39% the previous week (2/24/25-2/28/25).
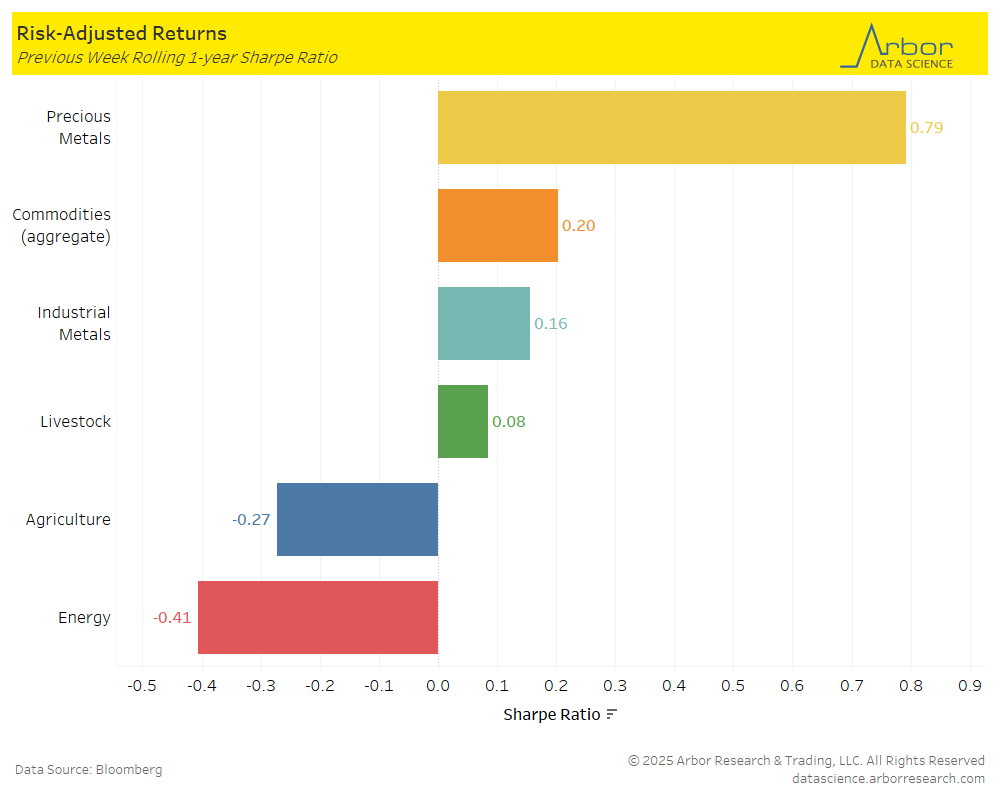
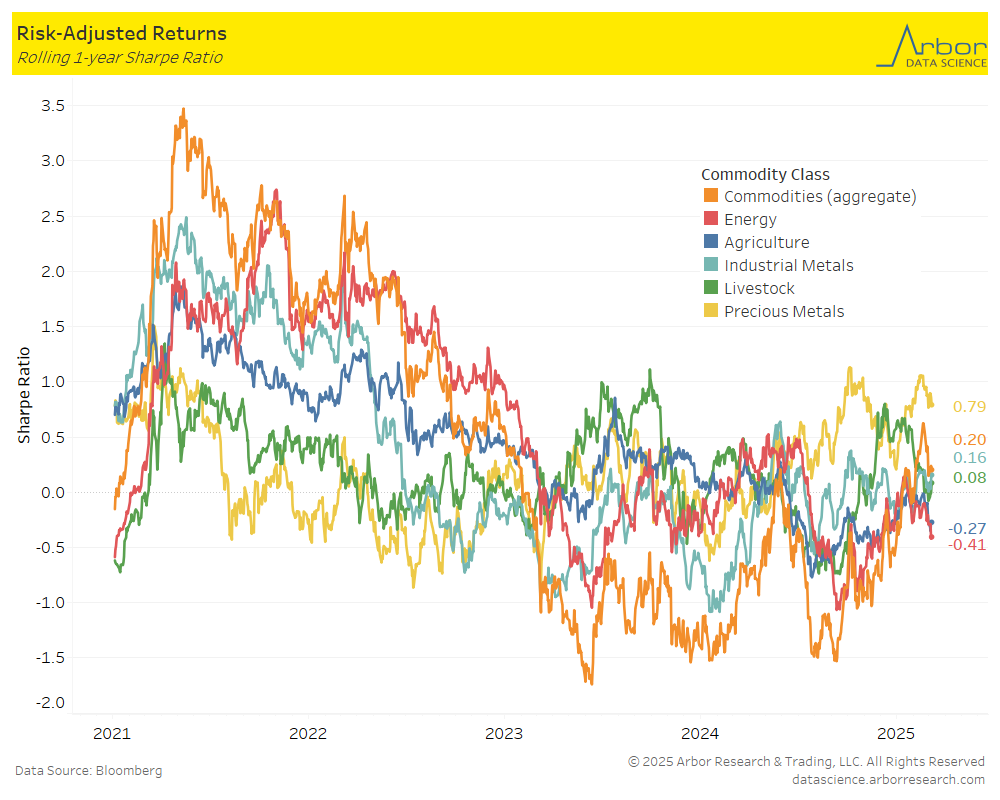
The first chart below outlines the week-over-week (3/3/25-3/7/25) aggregate Sharpe ratio for commodities. It was positive at 0.20 compared to 0.35 the prior week. The second chart is a rolling 1-year aggregate Sharpe ratio for commodities.
Performance mostly decreased week-over-week in all classes shown in the chart below, with the exception of Industrial Metals which increased to 0.16 from 0.09 last week. The largest decrease was in Energy at -0.41 from -0.21 the prior week.