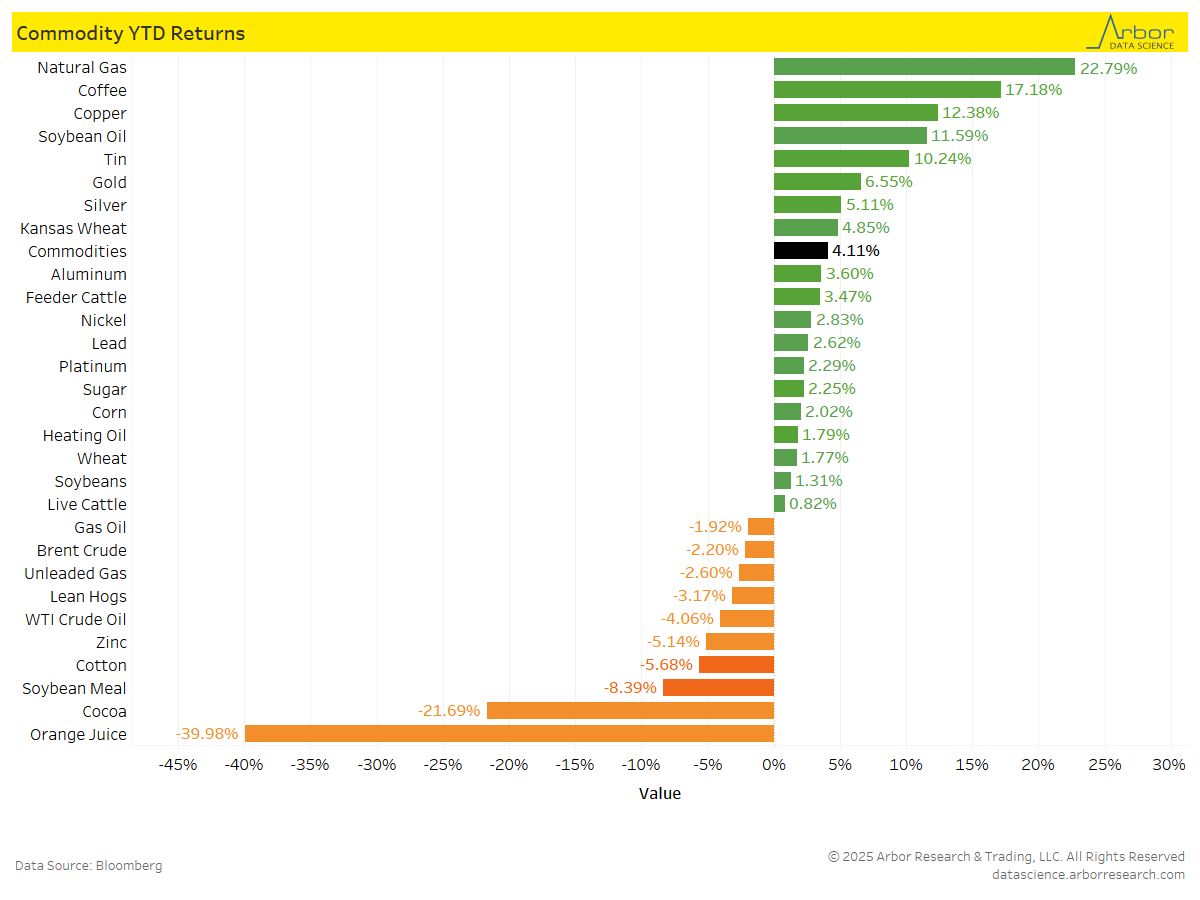
Bloomberg’s Commodity Index, which is calculated on an excess return basis and reflects commodity futures price movements, was up 4.11% on a year-to-date (YTD) basis as of 2/28/25.
YTD returns for commodities are shown in the chart below. Natural Gas had the highest YTD return at 22.79%, followed by Coffee at 17.18% and Copper at 12.38%. Orange Juice had the largest decrease, with a YTD return of -39.98%, followed by Cocoa at -21.69%.
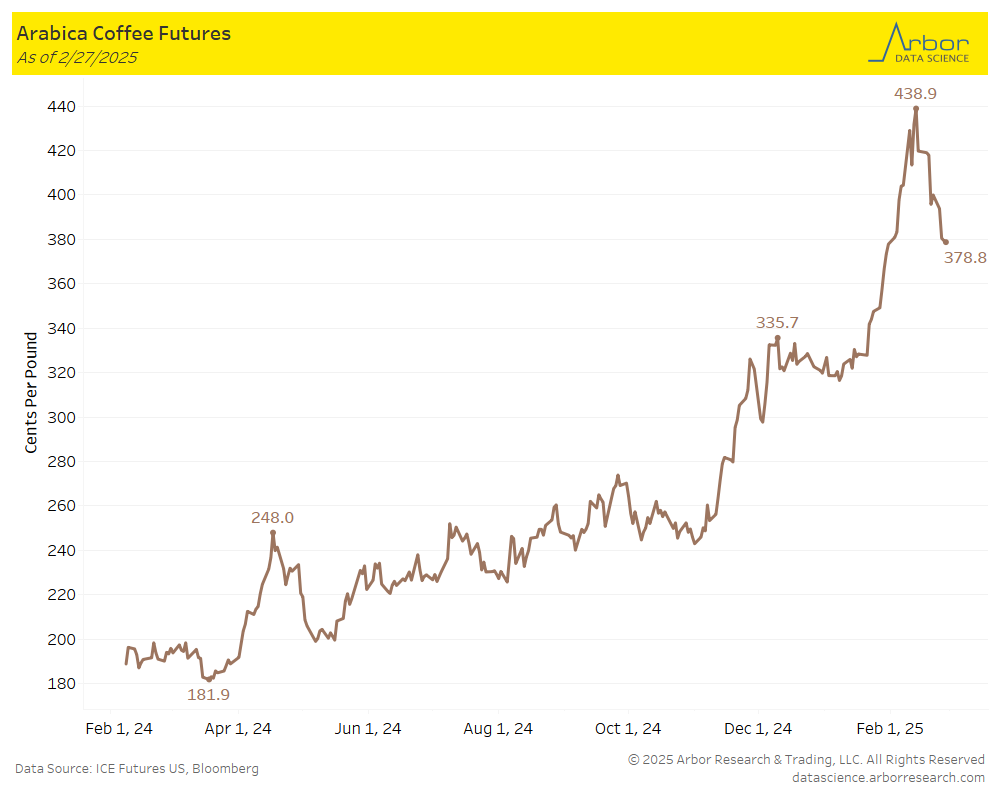
Arabica Coffee prices have been on the decline, dropping to 378.8 cents per pound on 2/27/25, while hitting a peak of 438.9 cents per pound on 2/13/25 two weeks ago.
Coffee prices have been negatively impacted by growing conditions and drought conditions in Brazil and Vietnam.
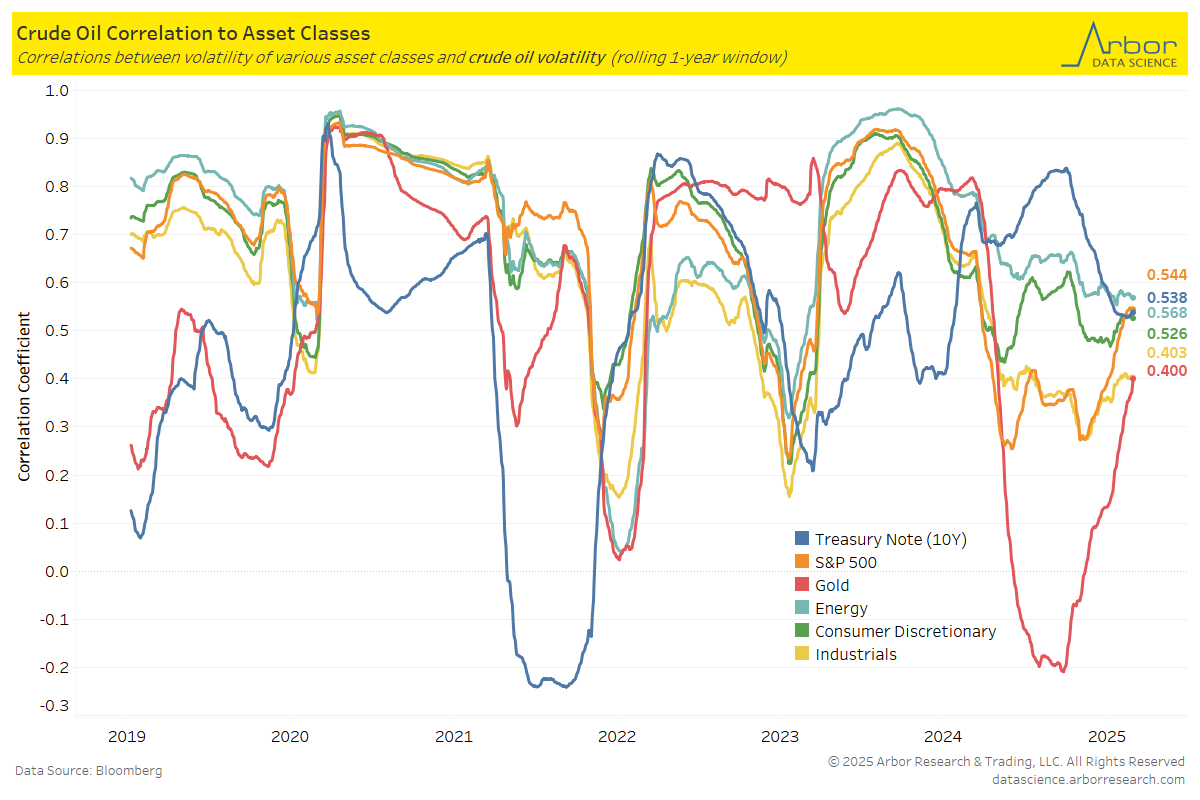
The chart below illustrates the correlations between volatility of crude oil and volatility of various asset classes.
As of 2/27/25, the 10-year Treasury Note volatility is the most correlated to crude oil volatility, with a correlation coefficient of 0.538.
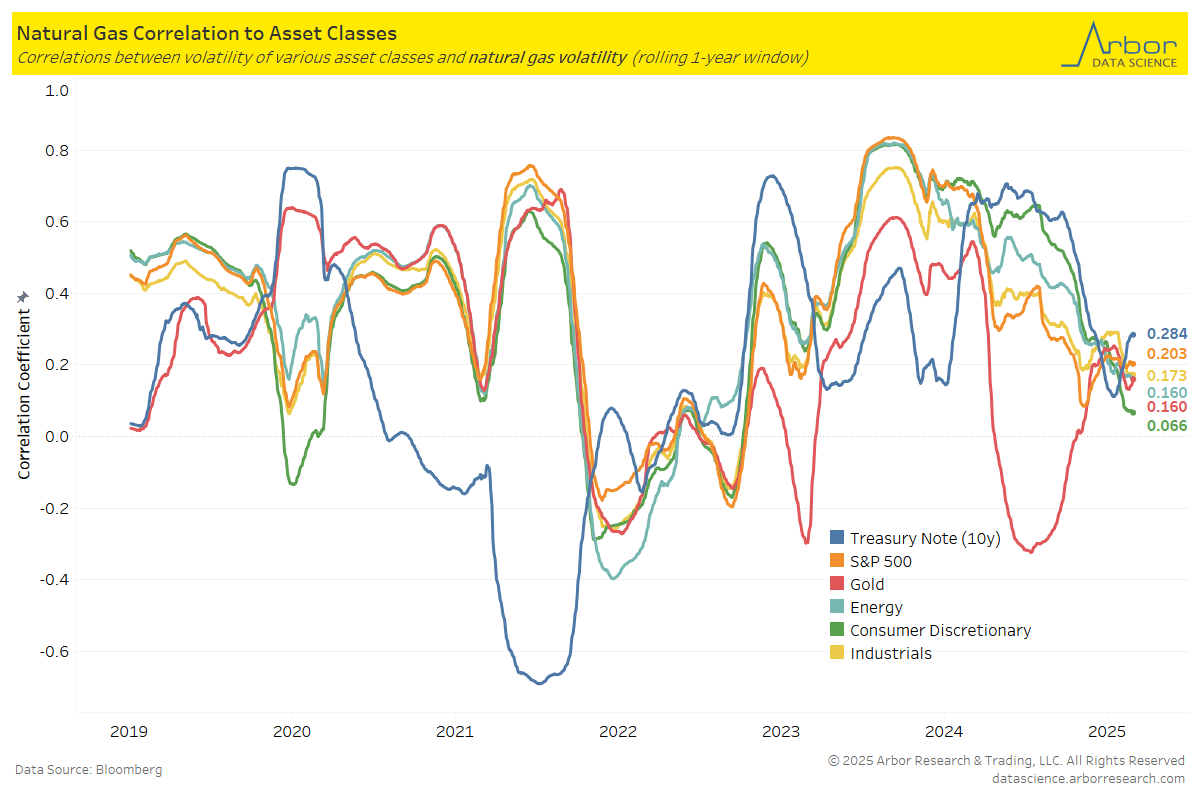
The next chart outlines the correlations between the volatility of natural gas and the volatility of various asset classes.
As of 2/27/25, the 10-year Treasury Note volatility is the most correlated to natural gas volatility, with a correlation coefficient of 0.284.
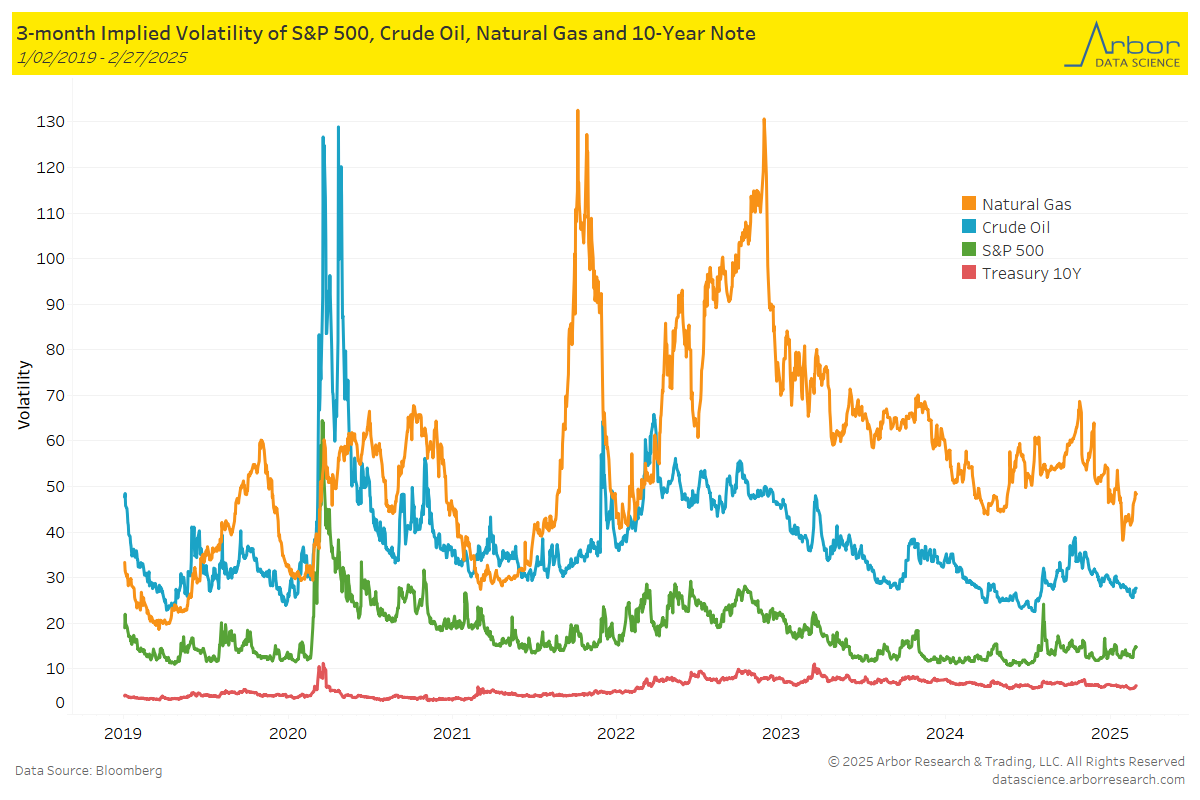
The chart below highlights the 3-month implied volatility of the S&P 500, crude oil, natural gas, and the 10-Year Note as of 2/27/25.
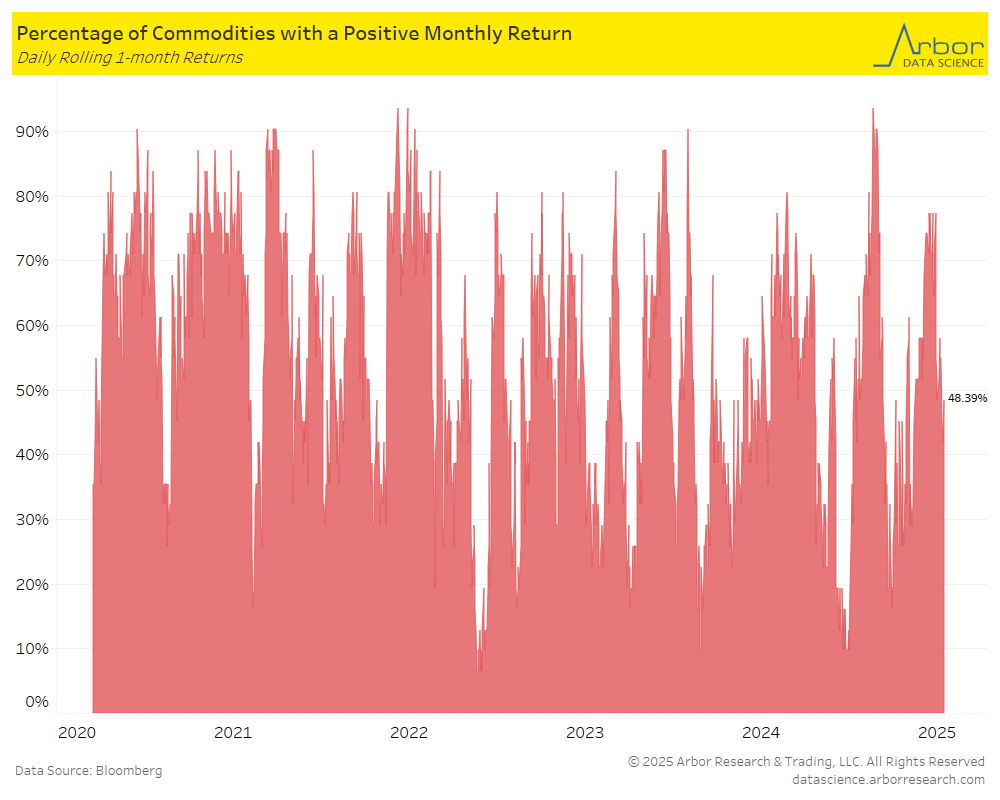
The percentage of all commodities with a positive monthly return decreased to 48.39% on 2/27/25 from 54.84% the previous week (2/17/25-2/21/25).
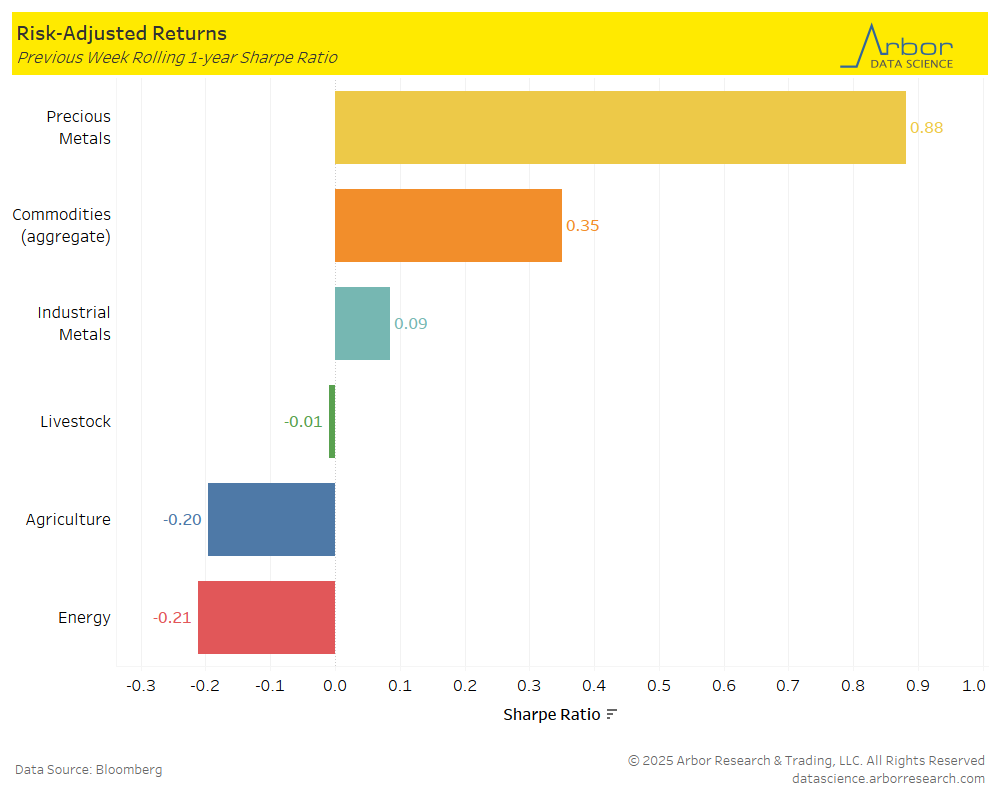
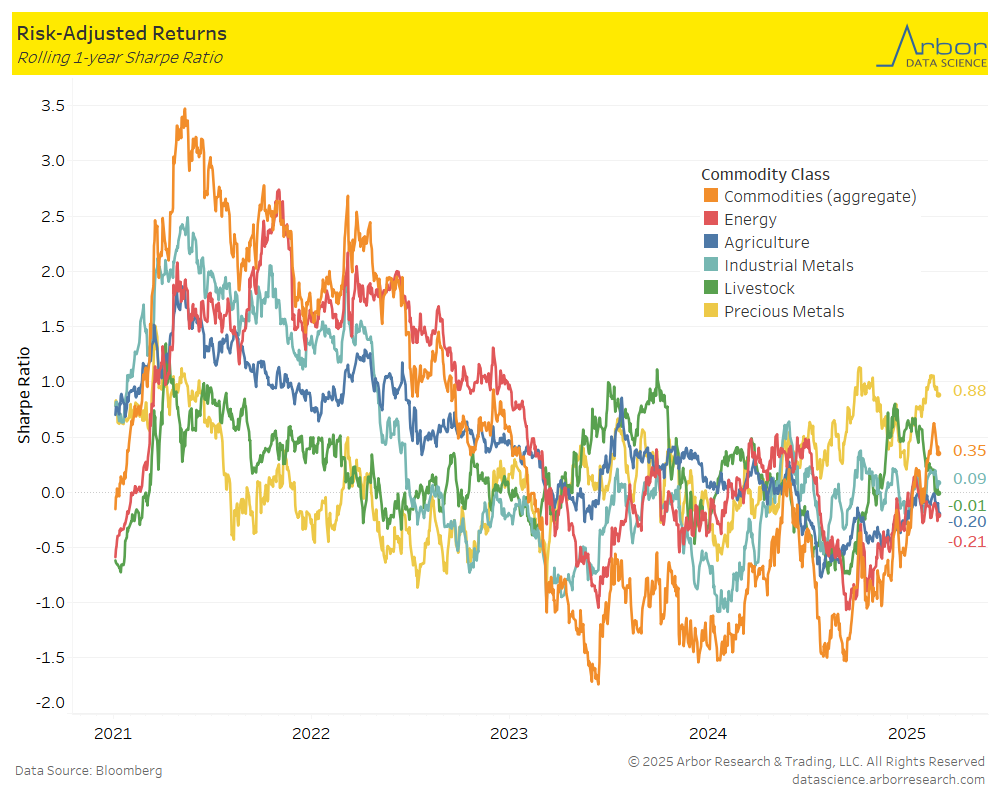
The first chart below outlines the week-over-week (2/24/25-2/28/25) aggregate Sharpe ratio for commodities. It was positive at 0.35 compared to 0.58 the prior week. The second chart is a rolling 1-year aggregate Sharpe ratio for commodities.
Performance mostly decreased week-over-week in all classes shown in the chart below, with the largest decrease in Agriculture at 0.20 from 0.03 the prior week.
 Arabica Coffee prices have been on the decline, dropping to 378.8 cents per pound on 2/27/25, while hitting a peak of 438.9 cents per pound on 2/13/25 two weeks ago.