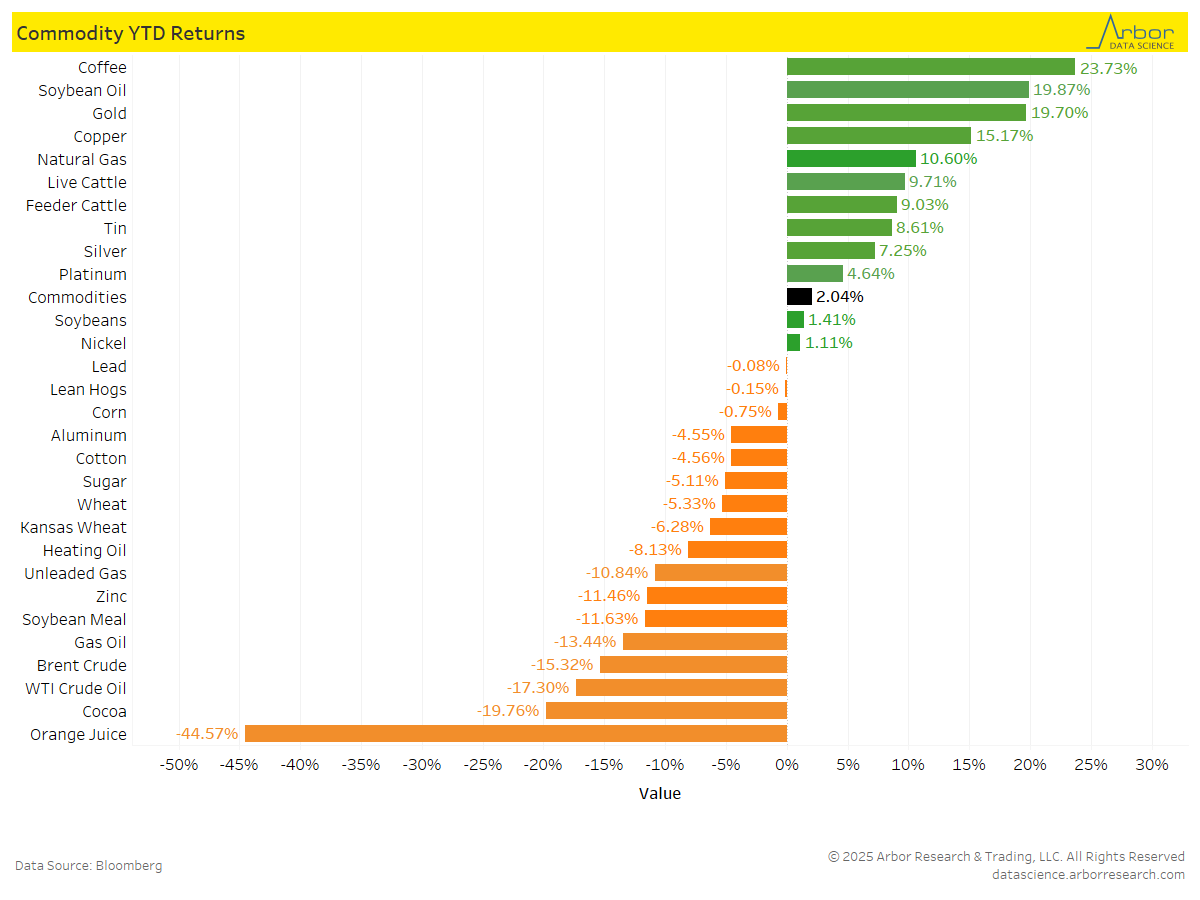
Bloomberg’s Commodity Index, which is calculated on an excess return basis and reflects commodity futures price movements, was up 2.04% on a year-to-date (YTD) basis as of 5/02/25.
YTD returns for commodities are shown in the chart below. Coffee had the highest YTD return at 23.73%, followed by Soybean Oil at 19.87% and Gold at 19.70%.
Orange Juice had the largest decrease, with a YTD return of -44.57%, followed by Cocoa at -19.76%.
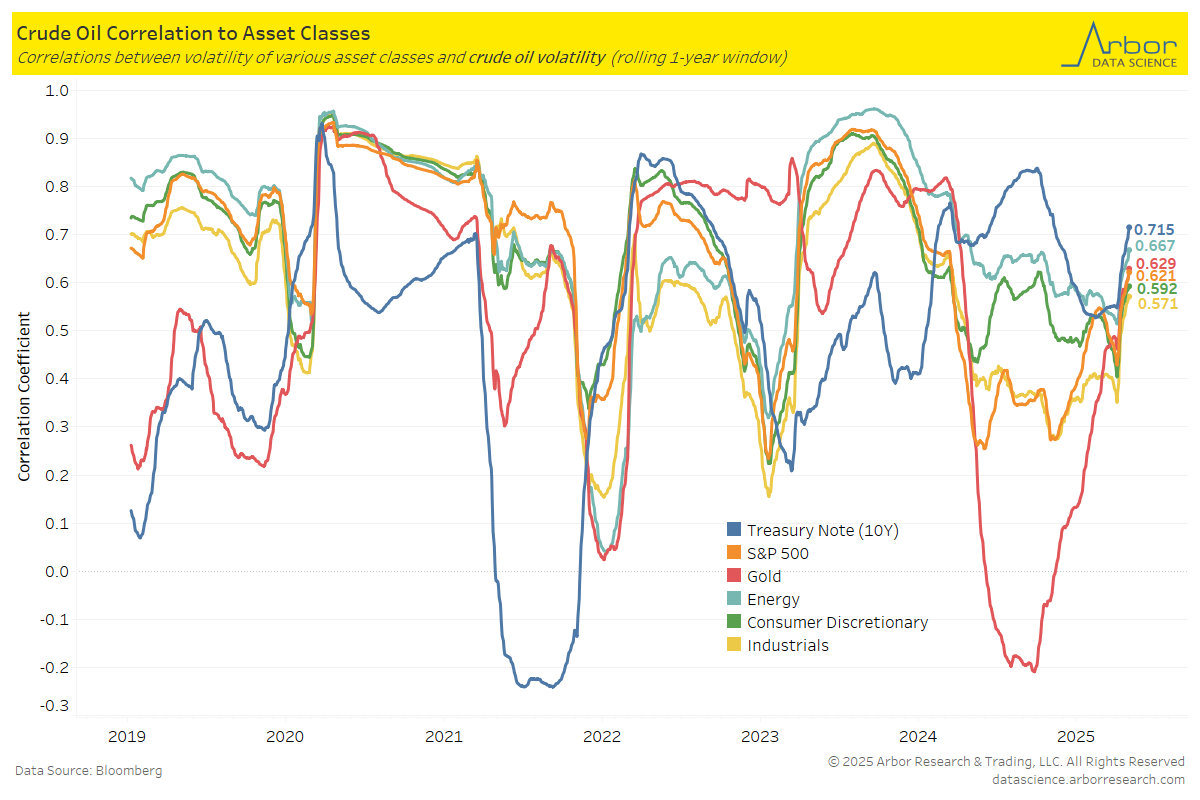
The chart below illustrates the correlations between volatility of crude oil and volatility of various asset classes.
As of 5/01/25, the 10-year Treasury Note volatility is the most correlated to crude oil volatility, with a correlation coefficient of 0.715.
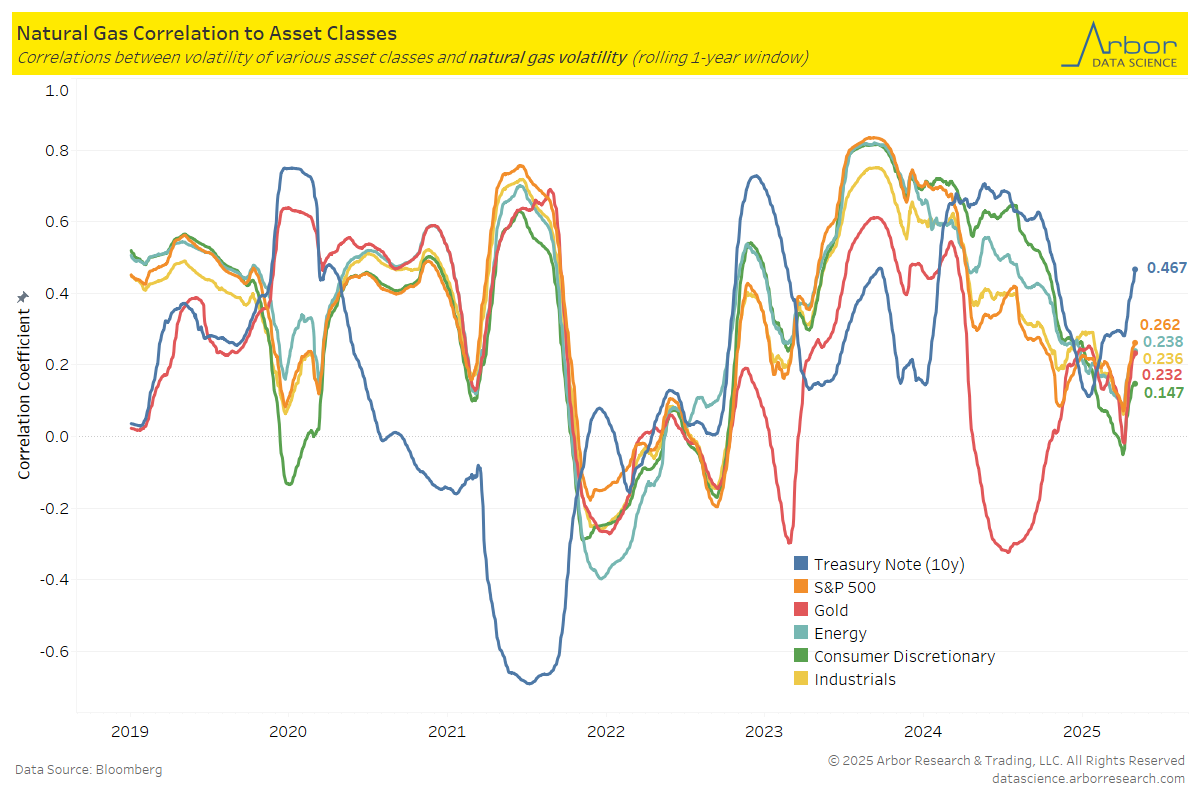
The next chart outlines the correlations between the volatility of natural gas and the volatility of various asset classes.
As of 5/01/25, the 10-year Treasury Note volatility is the most correlated to natural gas volatility, with a correlation coefficient of 0.467.
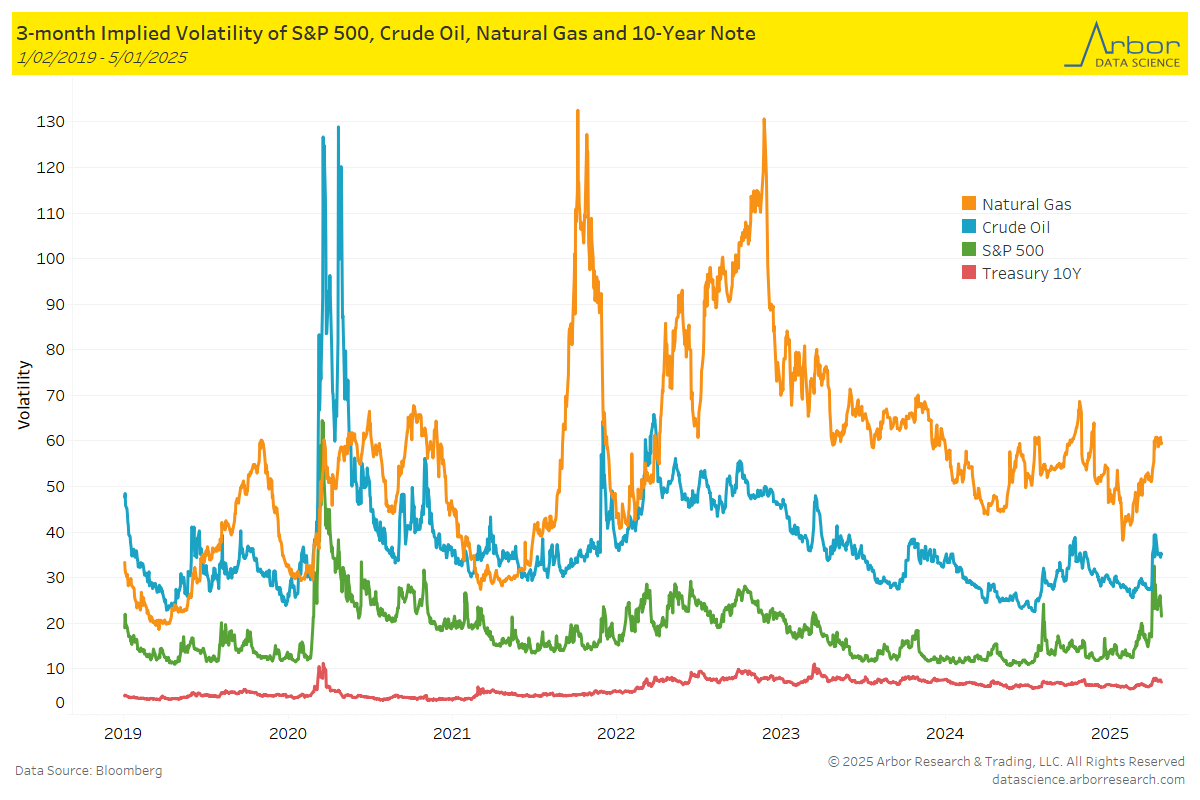
The chart below highlights the 3-month implied volatility of the S&P 500, crude oil, natural gas, and the 10-Year Note as of 5/01/25.
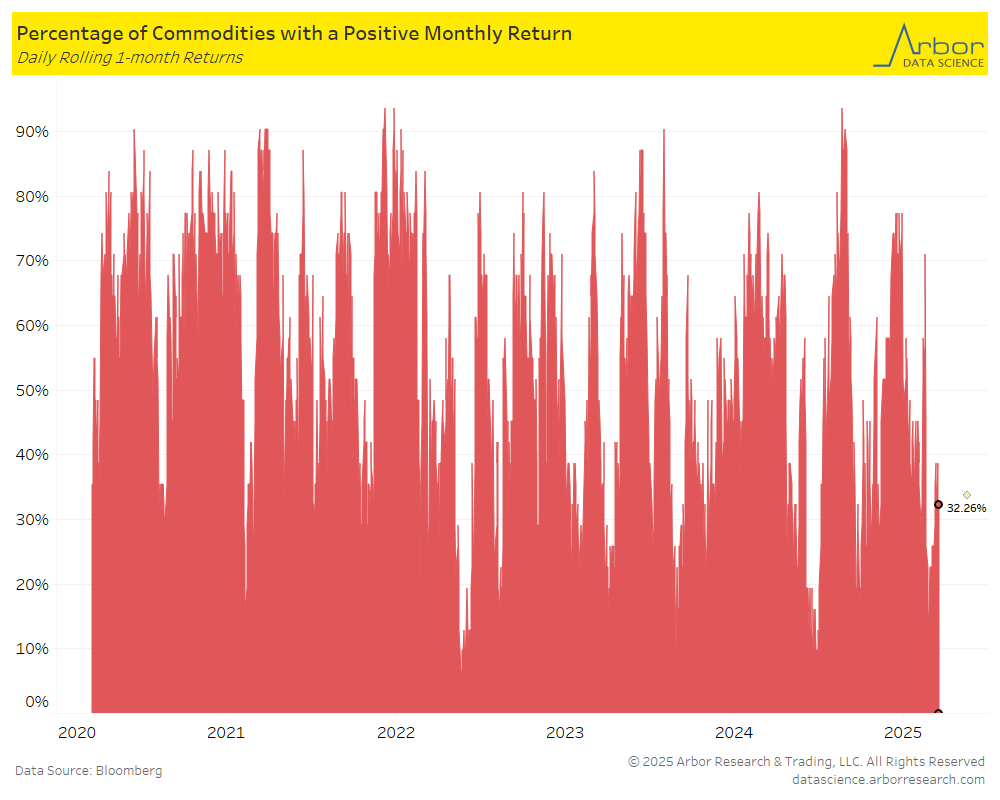
The percentage of all commodities with a positive monthly return decreased to 32.26% on 5/01/25 from 38.71% the previous week (4/21/25-4/25/25).
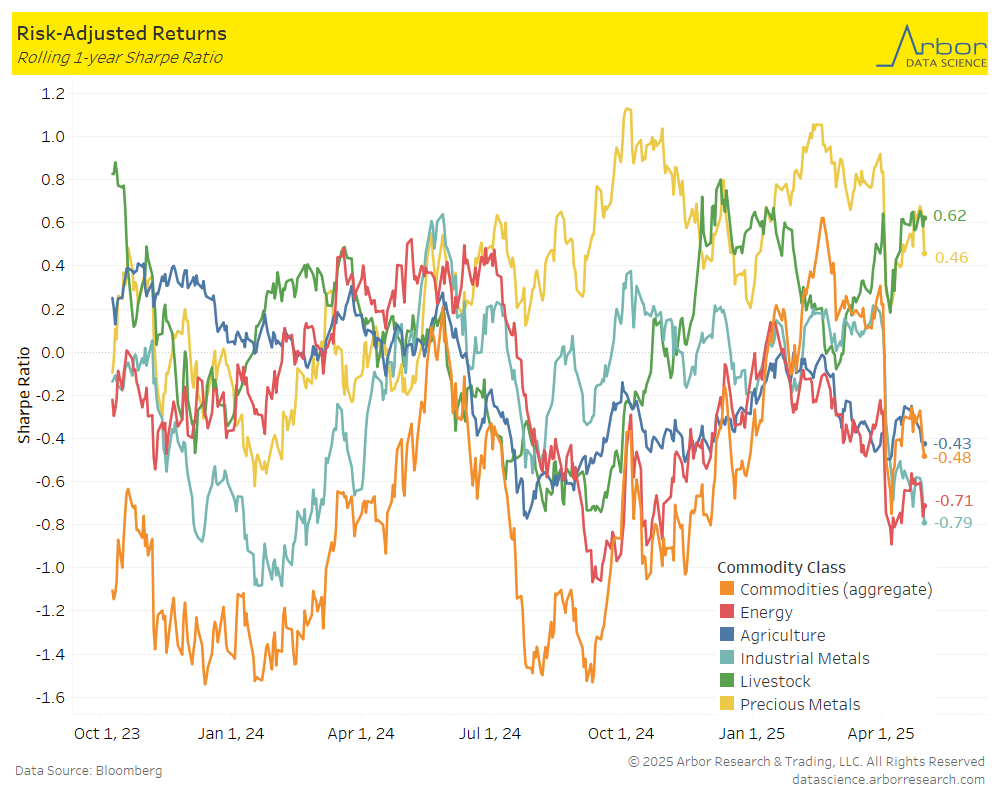
The first chart below outlines the week-over-week (4/28/25-5/2/25) aggregate Sharpe ratio for commodities. It was -0.48 compared to -0.29 the prior week. The second chart is a rolling 1-year aggregate Sharpe ratio for commodities.
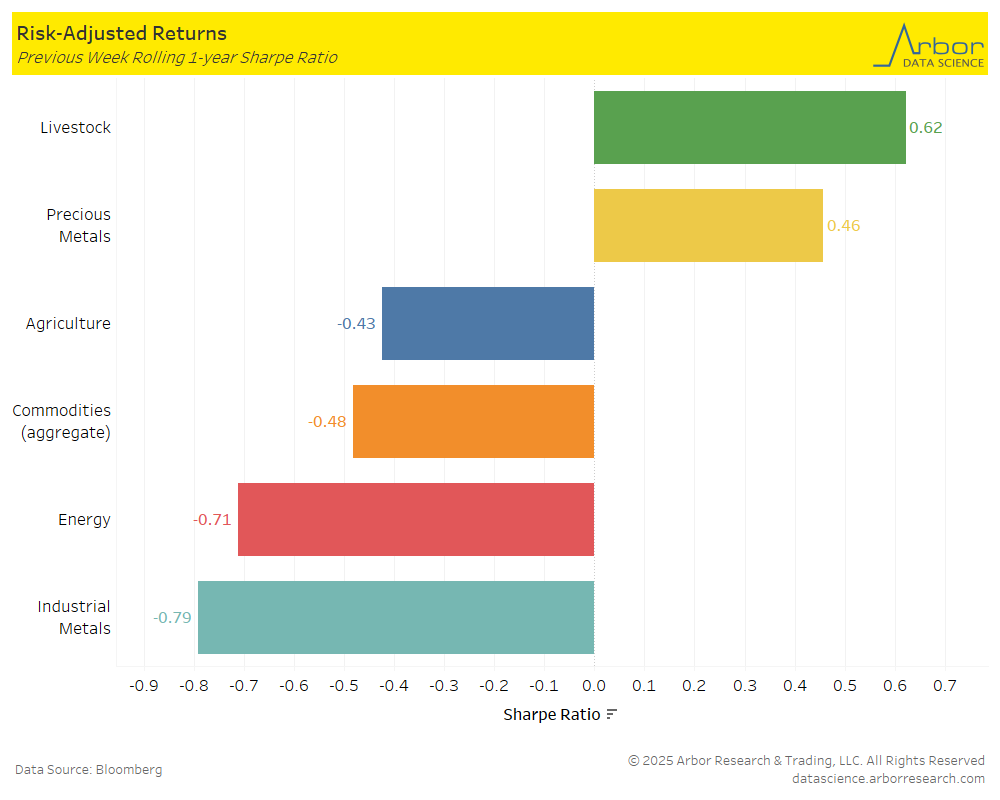
Performance was mixed week-over-week for the asset classes shown in the chart below The only increase was in Livestock at 0.62 from 0.57 last week. The largest decrease was in Precious Metals at 0.46 from 0.65 the prior week.