A Global Shock to the Agricultural Market
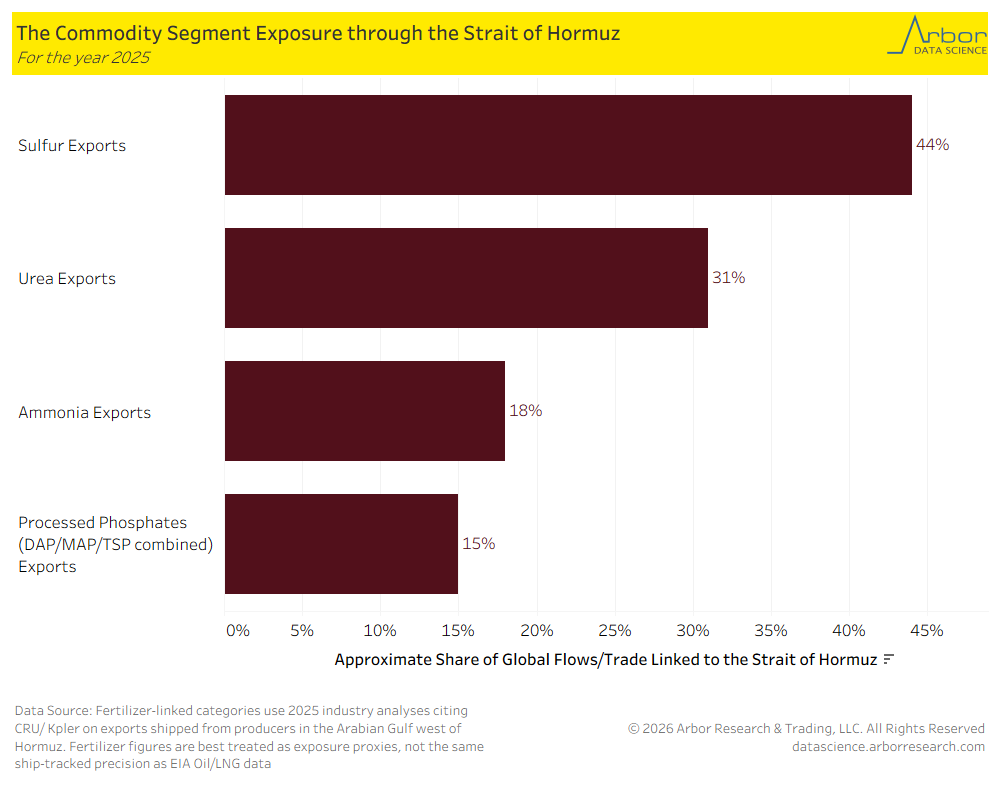
- The chart below outlines global fertilizer flows through the Strait of Hormuz in 2025.
- Of the total global flows through the Strait of Hormuz, sulfur led at 44%, while urea and ammonia represented 31% and 18%, respectively.
The Increase in Fertilizer Price
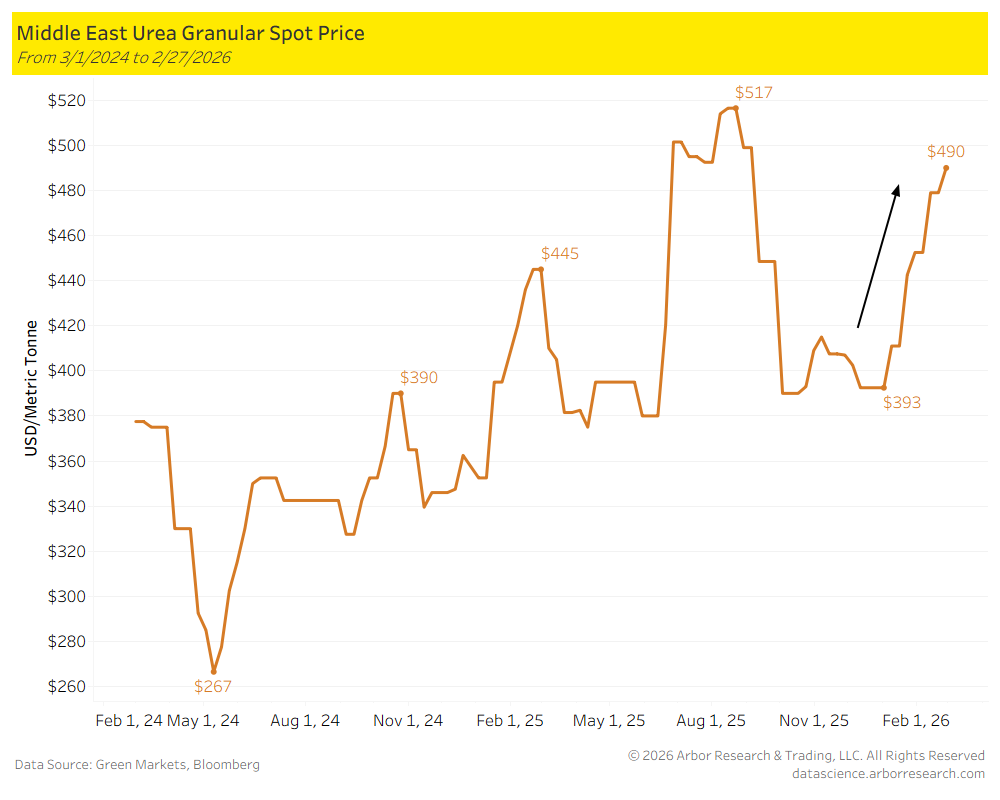
- Utilizing data from Green Markets, the weekly fertilizer price across key markets (U.S., Canada, China, Europe, Brazil, and Middle East) is illustrated in the chart below from 3/1/2024 to 2/27/2026. For the week ended on 2/27/2026, the price of fertilizer increased to $490 per metric tonne. The price has steadily increased since the beginning of the year, when the price was $393 per metric tonne.
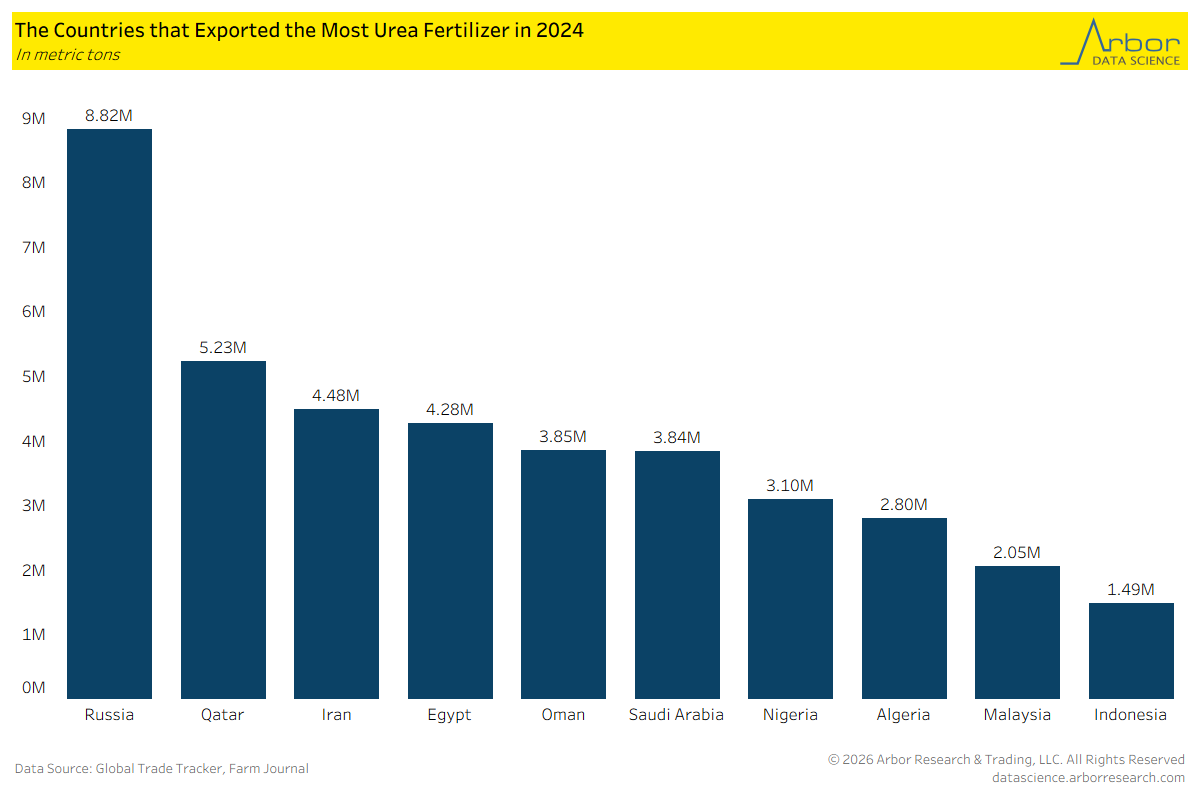
Countries that Exported the Most Urea Fertilizer
- The next chart outlines the top ten key exporters of Urea Fertilizer in 2024. Three out of the ten exporters are located on the Persian Gulf (just northwest of the Strait of Hormuz). If the Strait of Hormuz is “closed,” fertilizer shipments would seize up.
- The 2024 export levels of countries with a fertilizer plant located on the Persian Gulf were : Qatar with 5.23 million metric tons, Iran 4.48 million metric tons and Saudi Arabia at 3.84 million metric tons. A total of 13.55 million metric tons of Urea fertilizer was exported through the Strait of Hormuz in 2024.
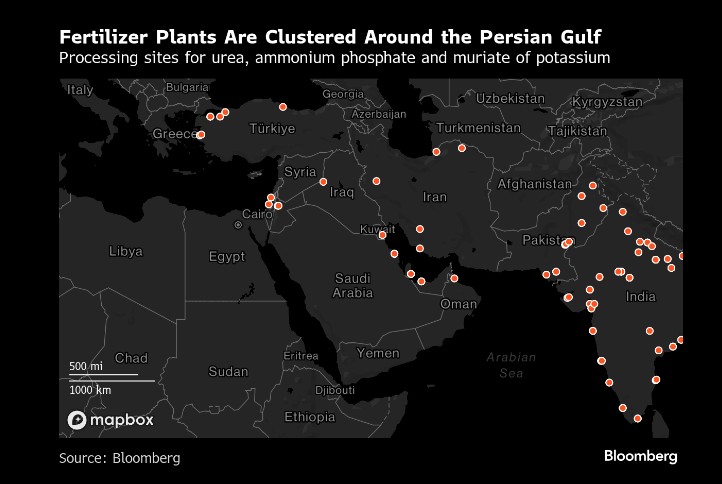
Below is a map of all Fertilizer Plants around the Strait of Hormuz:
Tanker Crossings in the Strait of Hormuz
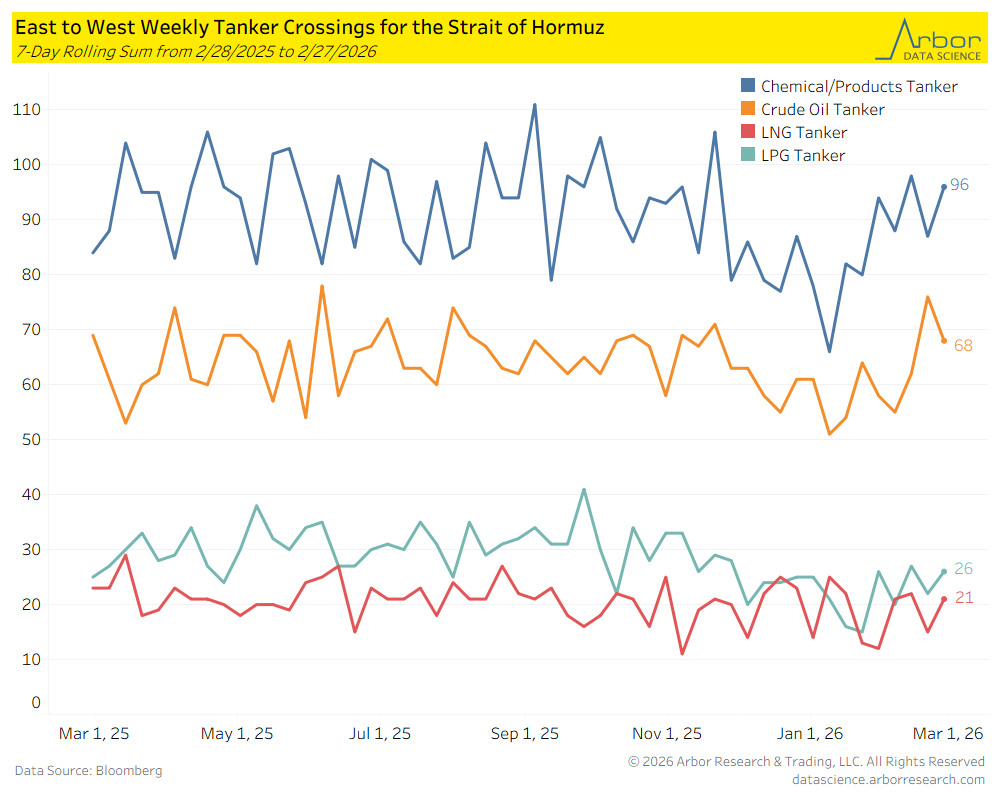
- East to West tanker crossing in the Strait of Hormuz for the week ended 2/27/2026: Chemical/Products Tankers (96), Crude Oil Tankers (68), LNG Tankers (26), LPG Tankers (21).
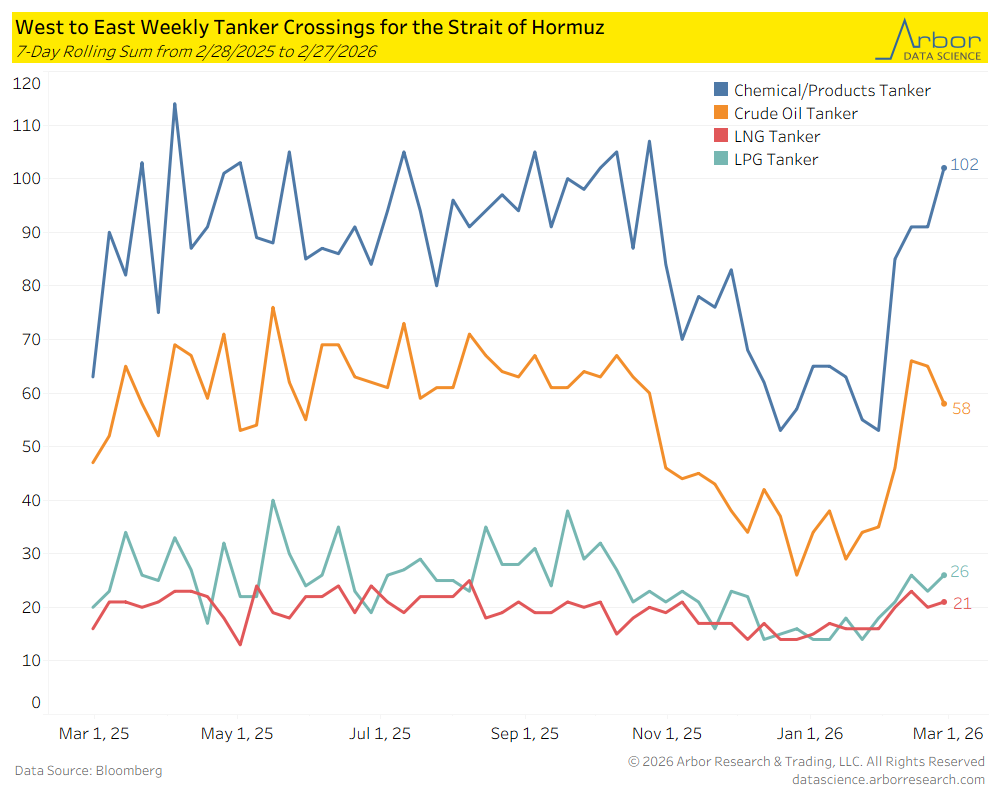
- West to East tanker crossings in the Strait of Hormuz for the week ended 2/27/2026: Chemical/Products Tankers (102), Crude Oil Tankers (58), LNG Tankers (21), LPG Tankers (26).
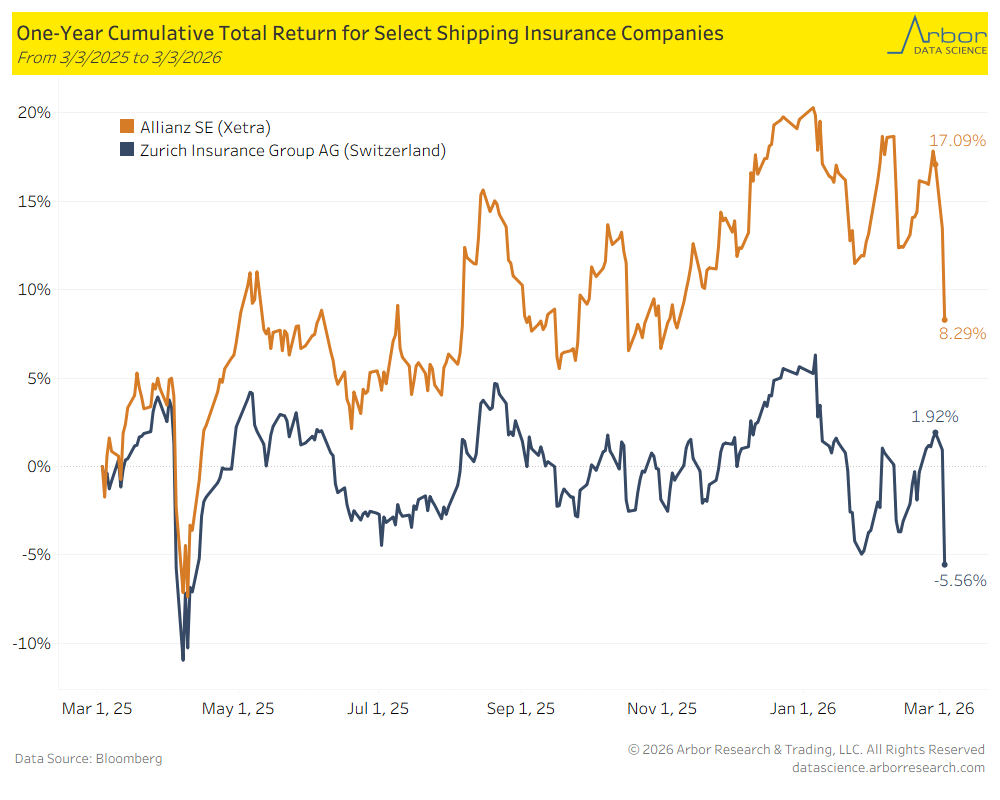
The Impact on Shipping Insurance Companies
- Many maritime insurers have cancelled their war risk coverage for vessels in the Middle East due to the ongoing conflict between the U.S./Israel and Iran.
- Year-to-date returns for Allianz decreased from 17.09% on 2/27/2026 to 8.29% on 3/2/2026. Year-to-date returns for Zurich decreased from 1.95% on 2/27/2026 to -5.56% on 3/2/2026.
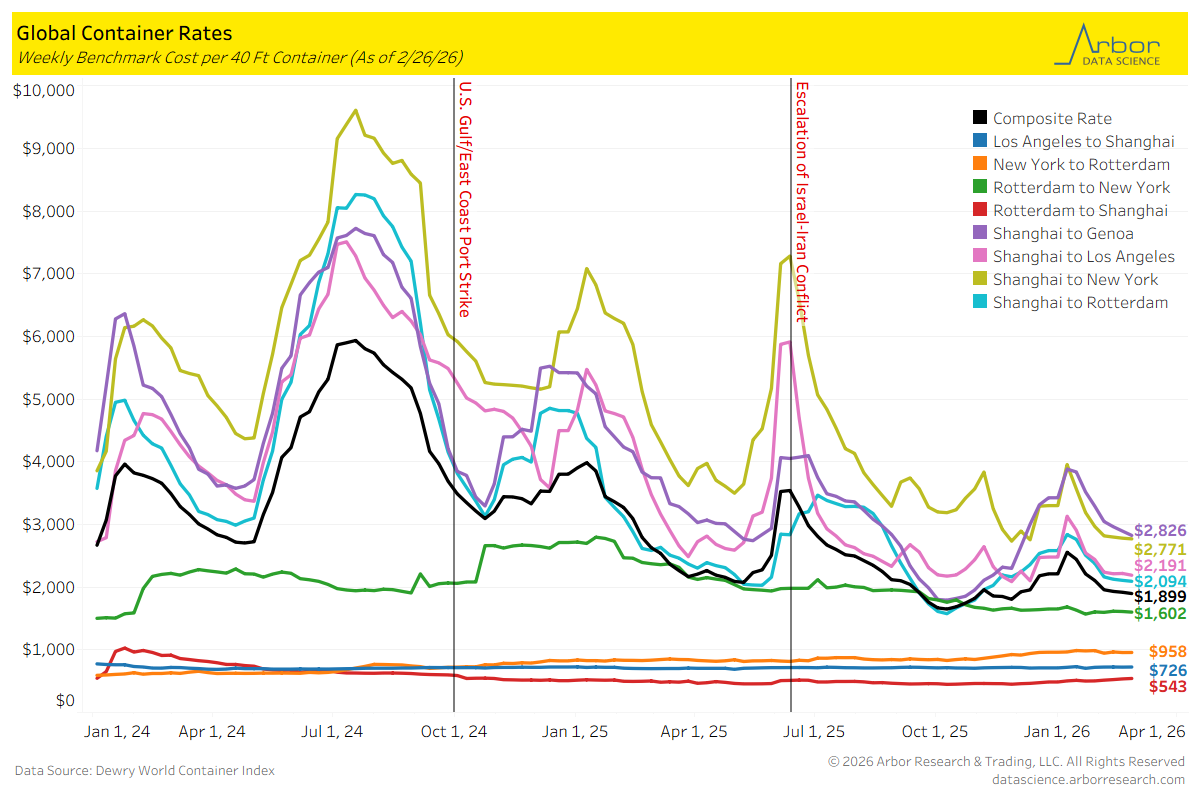
Global Container Rates
- The composite rate per 40-foot container was $1,898.54 on 2/26/2026, which is down $20 from 2/19/2026. Global container rates mostly declined from 2/19/2026 to 2/26/2026. The largest decrease was from Shanghai to Genoa which decreased $69 to $2,826. The second-largest decrease was from Shanghai to Los Angeles, which decreased $28 to $2,191.
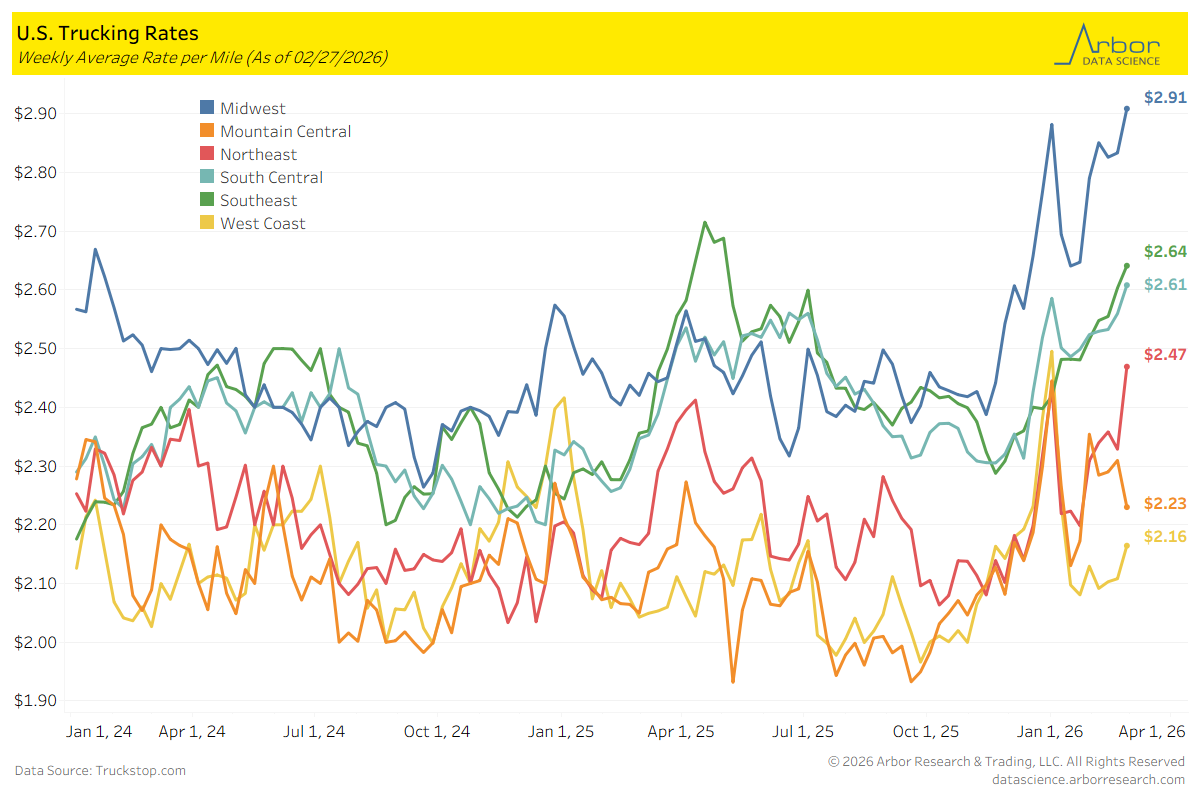
U.S. Trucking Rates
- The Internet Trucks Spot Average Equipment rate was $2.63 per mile as of 02/27/2026.
- Trucking rates on a geographical basis was mostly positive over the past week. The rate for the Northeast region had the largest increase by $0.14 per mile. The rate for the Midwest region had the only decrease by $0.08 per mile.
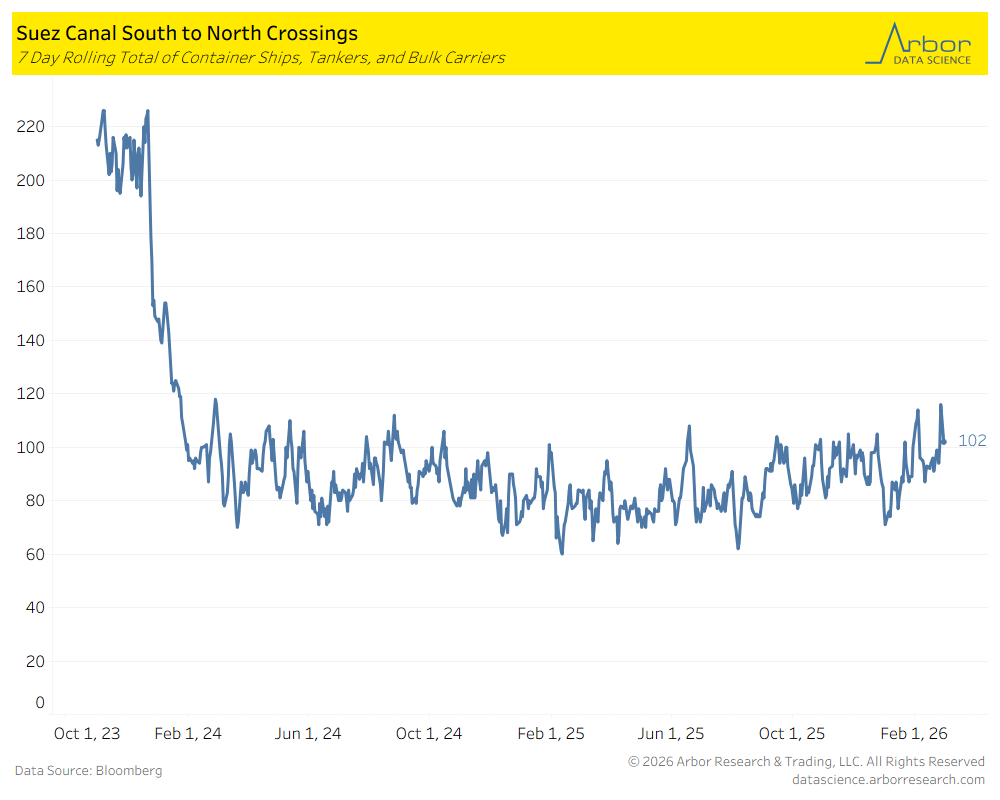
Suez Canal Crossings
- The chart below outlines the 7-day rolling total of container ships, tankers, and bulk carriers traveling South to North through the Suez Canal.
- The total number of crossings on 03/02/2026 was 102 (compared to 83 on 03/03/2025 and 111 on 03/01/2024).
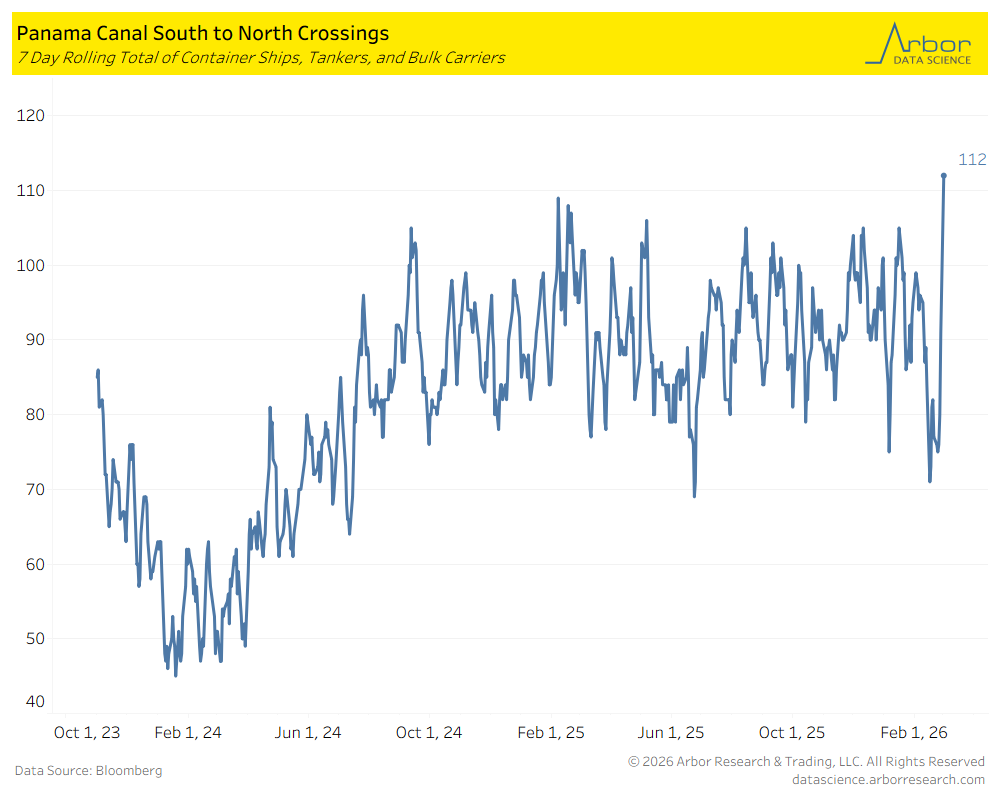
Panama Canal Crossings
- The chart below outlines the 7-day rolling total of container ships, tankers, and bulk carriers traveling South to North through the Panama Canal.
- The total number of crossings on 03/02/2026 was 112 (compared to 102 on 03/03/2025).
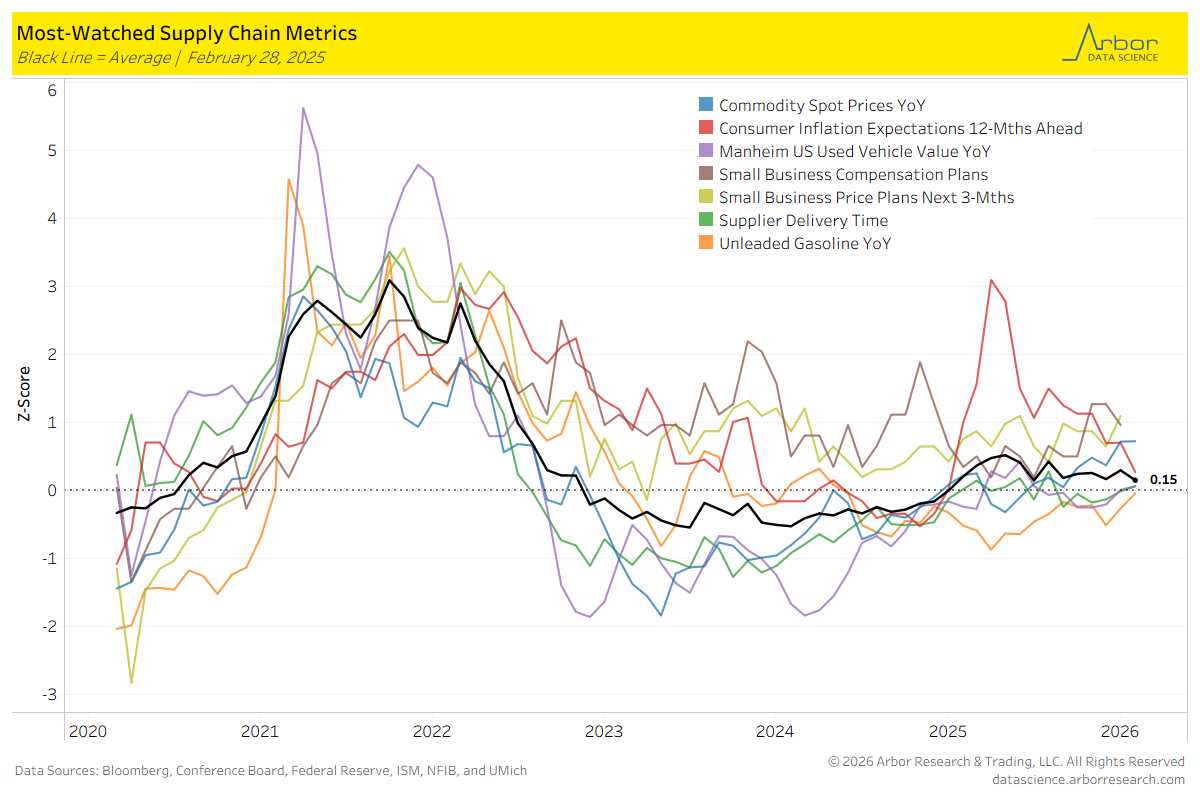
Most-Watched Supply Chain Metrics
- The chart below is a breakdown of supply chain metrics for February 2026.
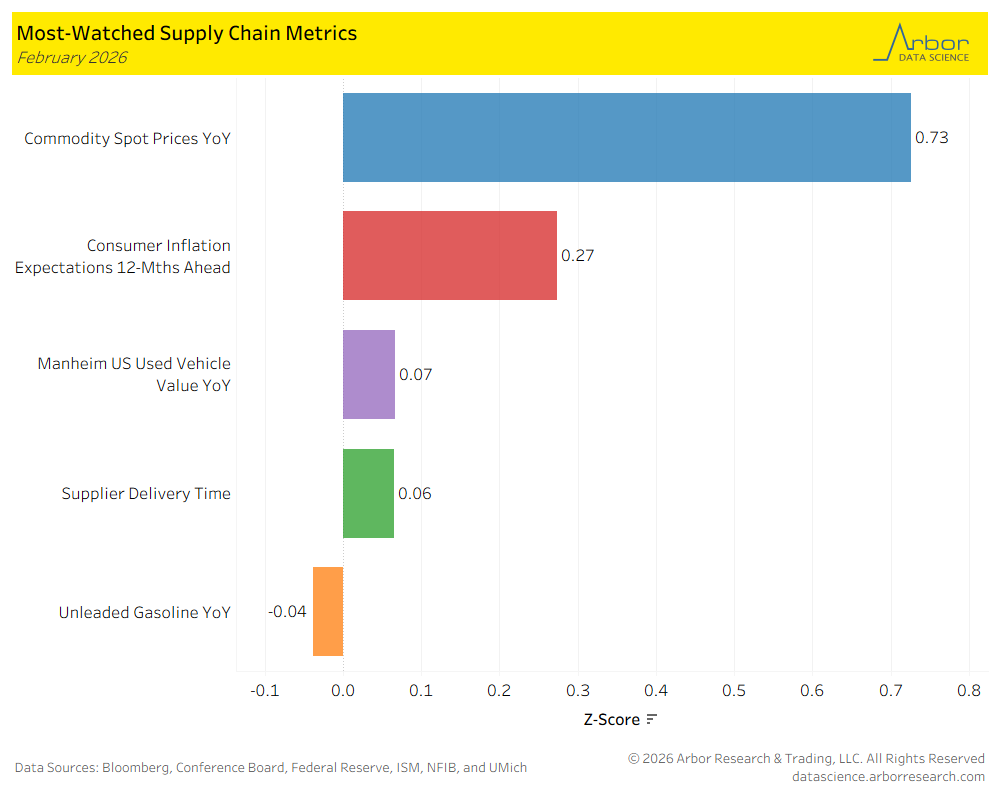
- The aggregate index of most-watched supply chain metrics (the black line in the chart below) was 0.15, with zero meaning the supply chain is acting normally.
Tables