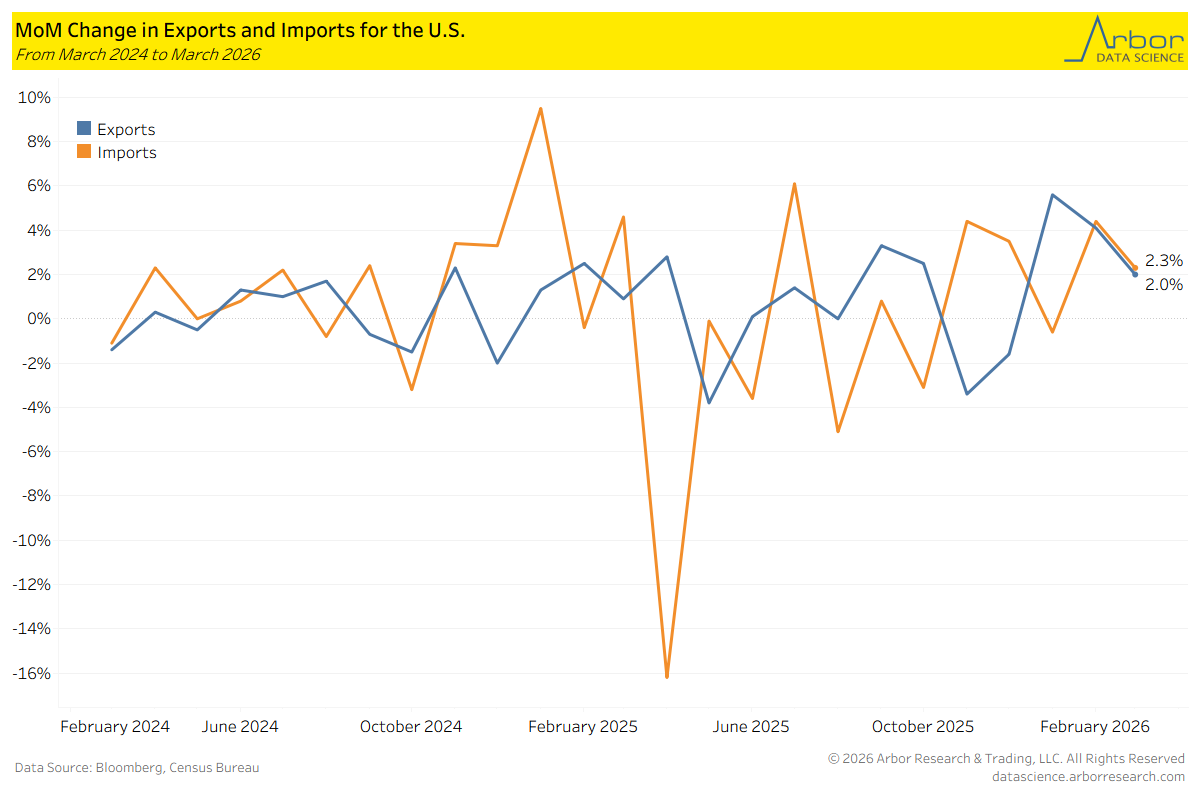
The Growth of Imports and Exports
- The value of imports and exports for the U.S. increased by 2.3% and 2.0%, respectively, in March 2026.
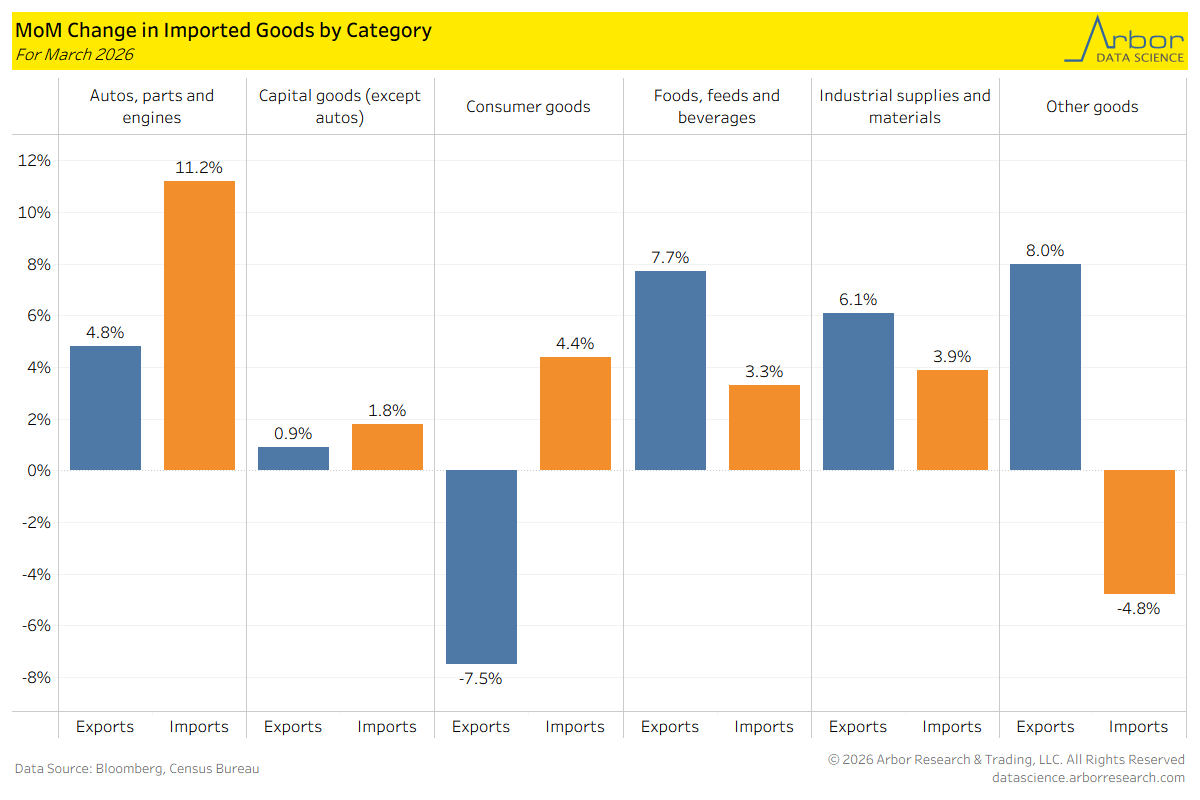
- The category of goods exported that increased the most MoM in March 2026 was Other goods, at 8.0%.
- Autos, parts and engines increased by 11.2% MoM in March 2026, which was the largest increase of any imported goods category.
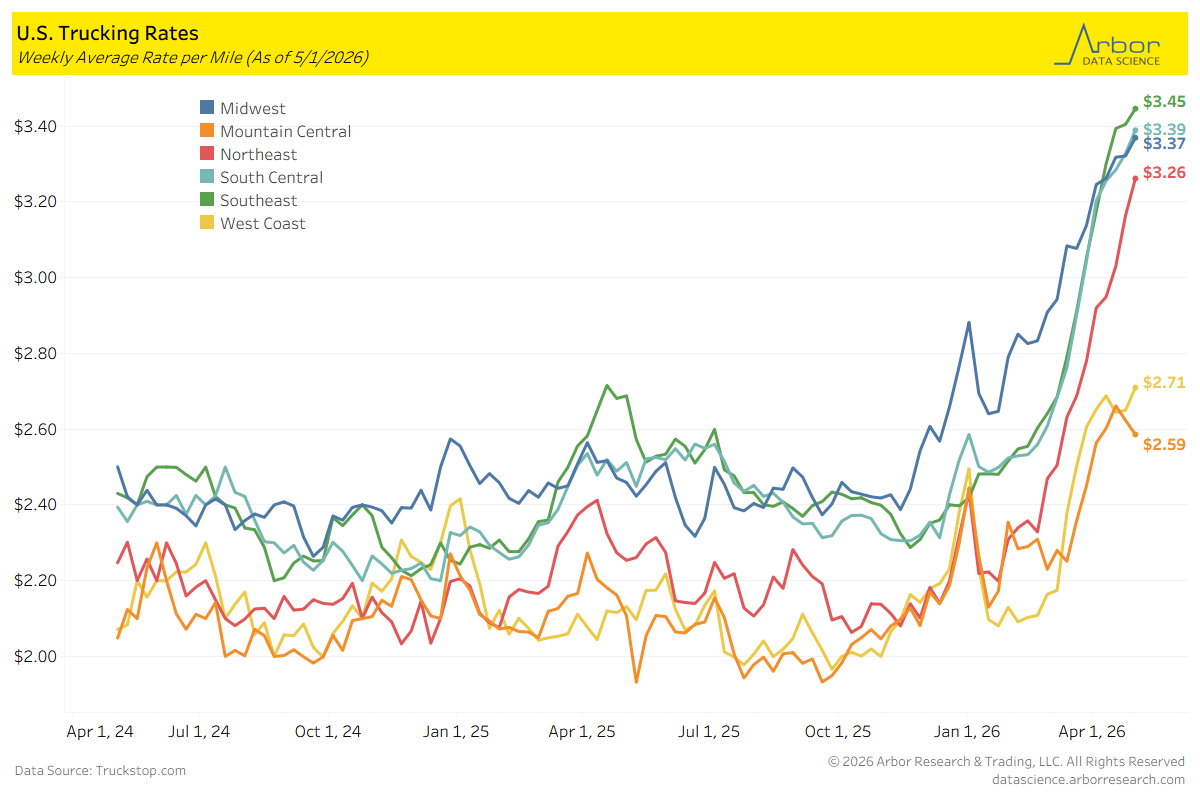
U.S. Trucking Rates
- The Internet Trucks Spot Average Equipment rate was $3.32 per mile as of 5/1/2026.
- Trucking rates for all geographical regions mostly increased over the past week. The rate for the Northeast region had the largest increase of $0.10 per mile. The only decrease was in the Mountain Central region, at -$0.04 per mile.
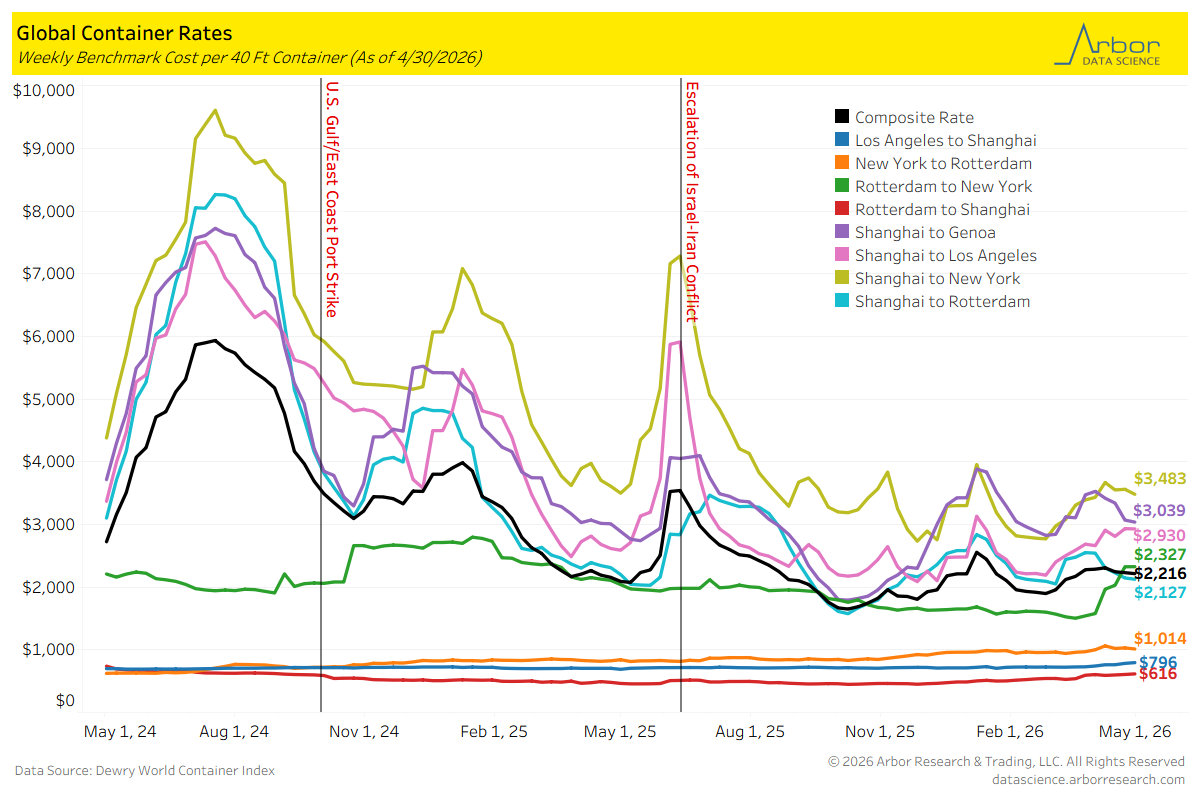
Global Container Rates
- The composite rate per 40-foot container was $2,216 on 4/30/2026, which is down $16 from 4/23/2026.
- Global container rates were mixed from 4/23/2026 to 4/30/2026. The largest increase was from Los Angeles to Shanghai , which increased $12 to $796. The largest decrease was from Shanghai to New York, which decreased $79 to $3,483.
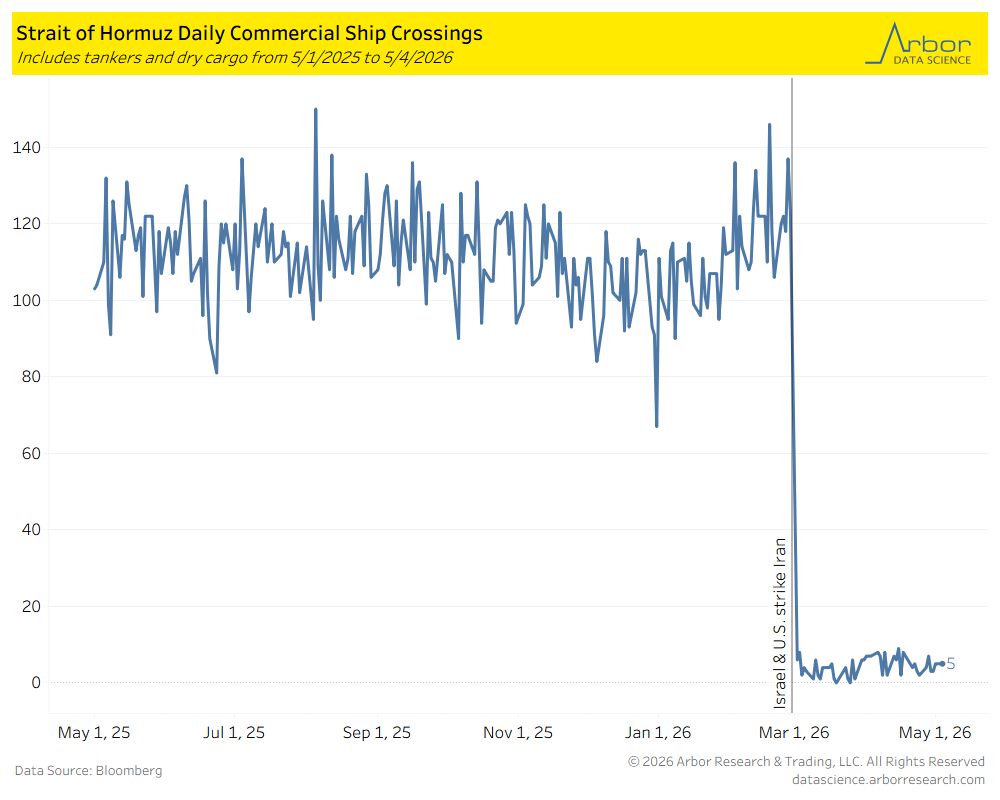
Strait of Hormuz Crossings
- According to Bloomberg Analysis of automatic identification systems (AIS), there were 5 tankers and dry cargo ships that crossed through the Strait of Hormuz on 5/4/2026.
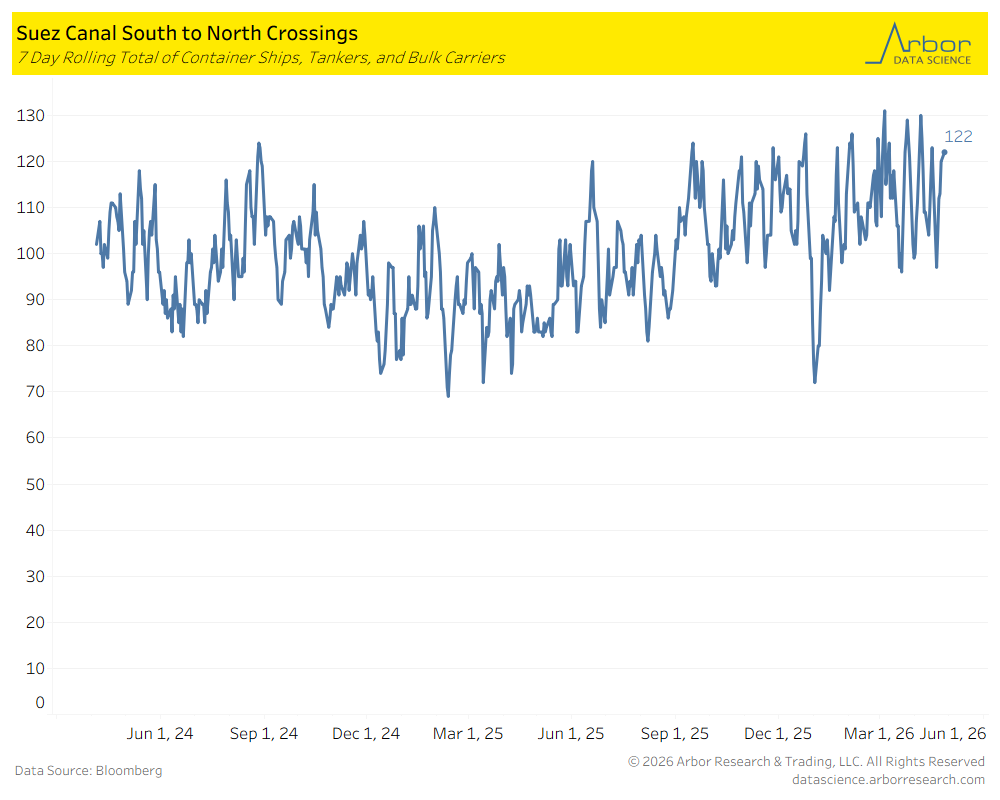
Suez Canal Crossings
- The chart below outlines the 7-day rolling total of container ships, tankers, and bulk carriers traveling South to North through the Suez Canal.
- The total number of crossings on 5/4/2026 was 122.
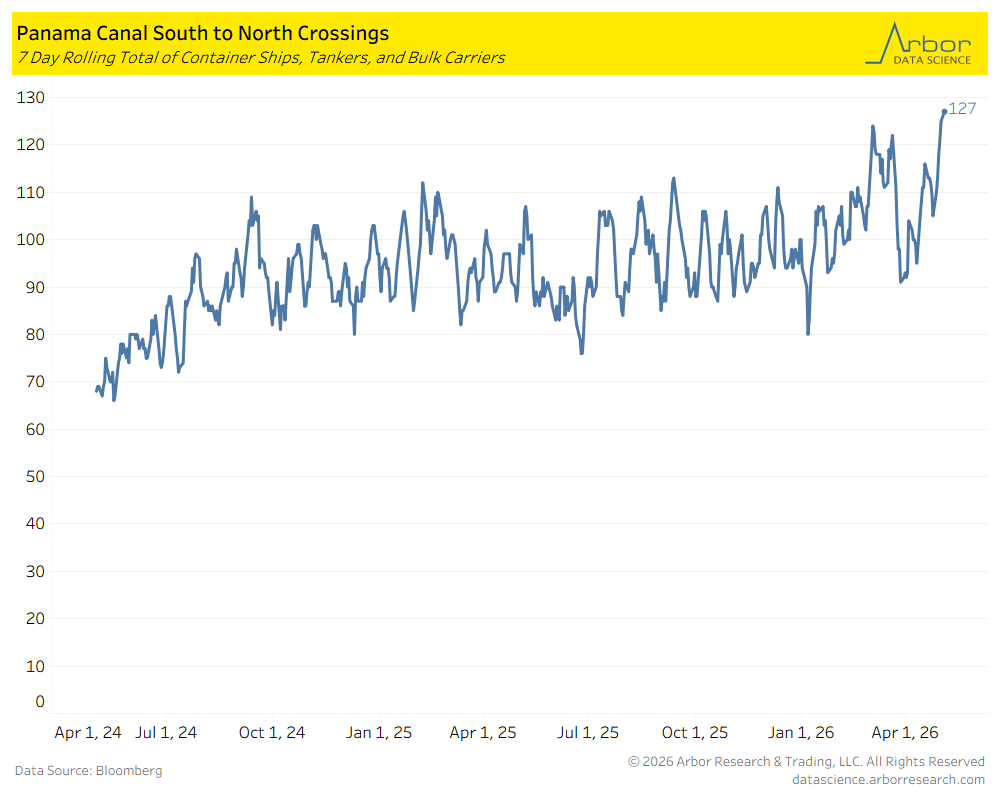
Panama Canal Crossings
- The chart below outlines the 7-day rolling total of container ships, tankers, and bulk carriers traveling South to North through the Panama Canal.
- The total number of crossings on 5/4/2026 was 127.
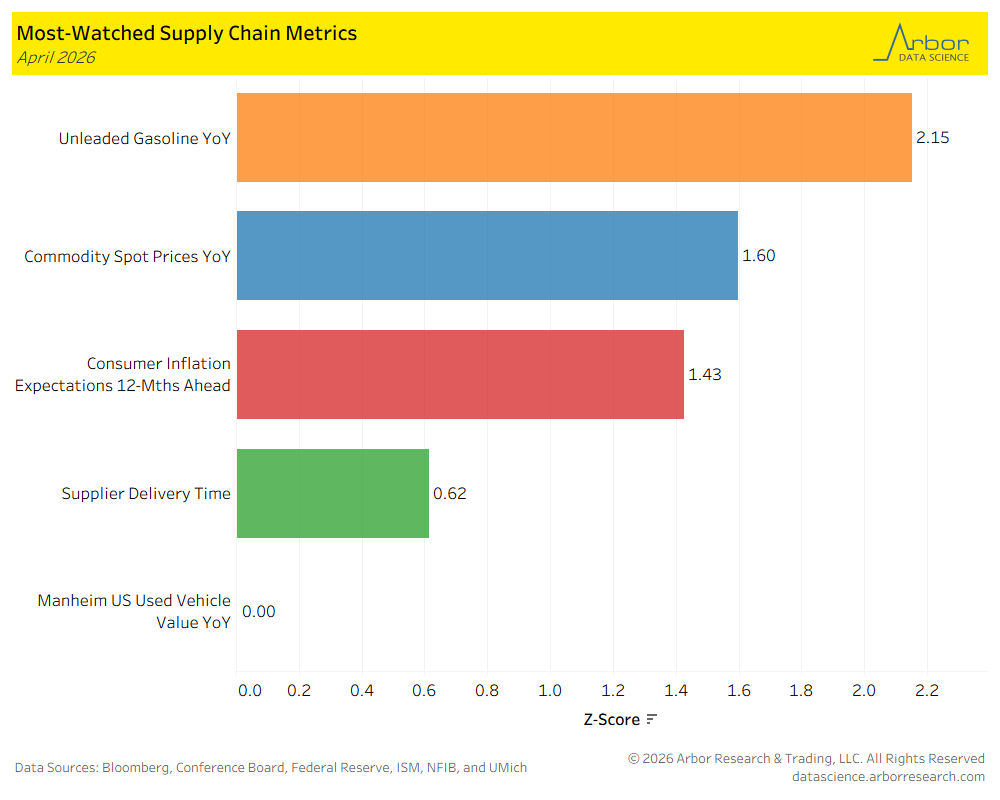
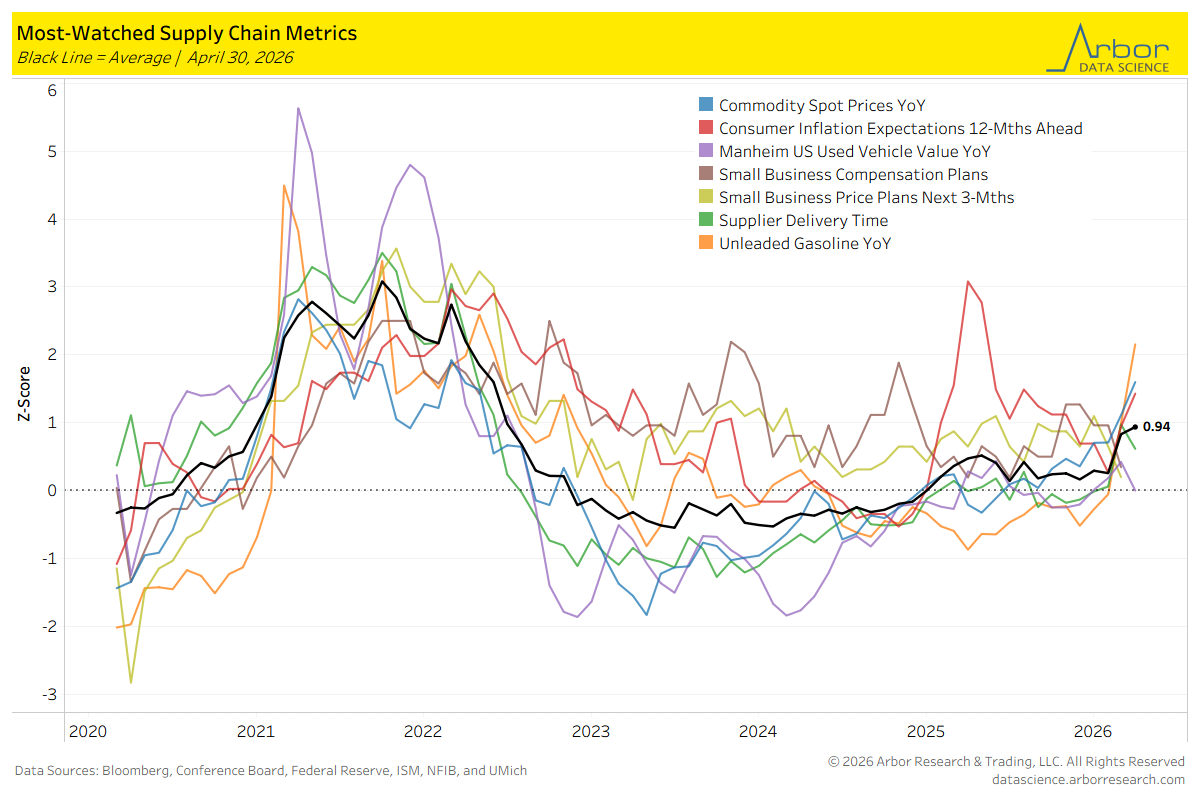
Most-Watched Supply Chain Metrics
- The chart below is a breakdown of supply chain metrics for April 2026.
- The aggregate index of most-watched supply chain metrics (the black line in the chart below) was 0.94, with zero meaning the supply chain is acting normally.
Tables