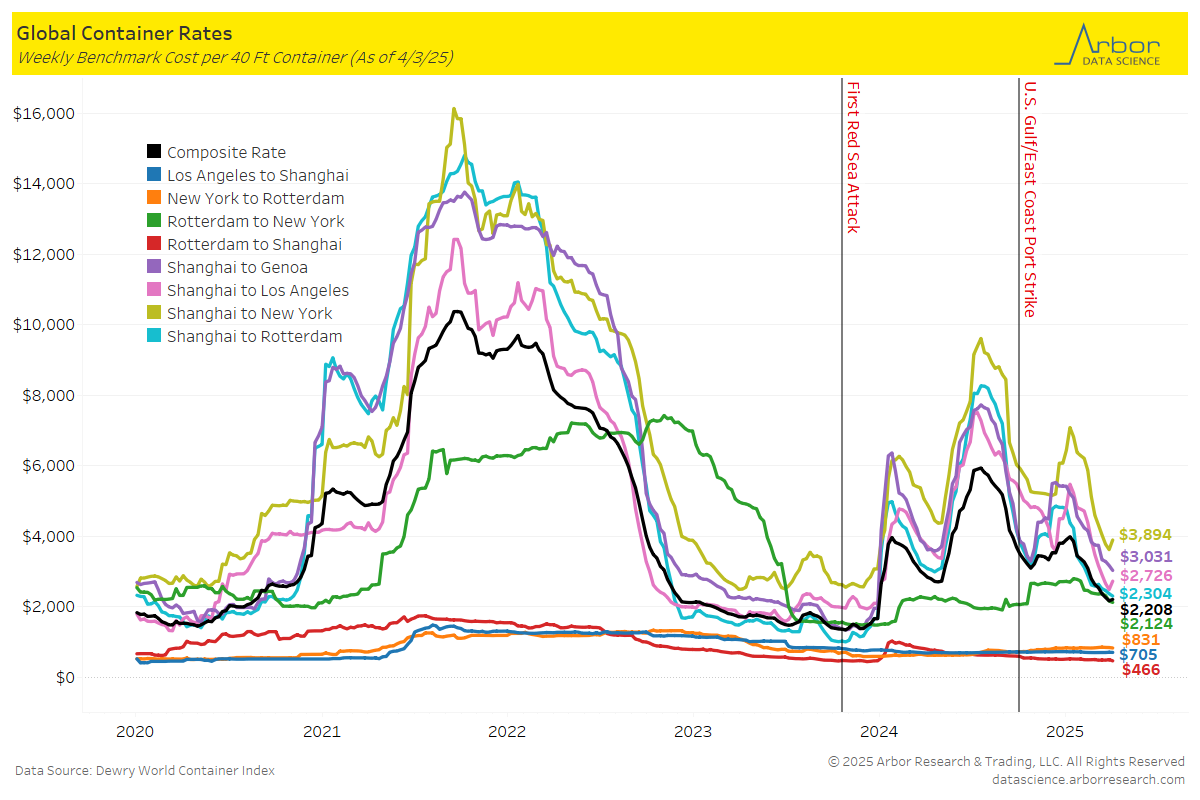
Global Container Rates
- The composite rate per 40-foot container was $2,208 on 4/3/25, which is up $40 from the previous week. Global container rates mostly decreased week-over-week. The largest decrease was from Shanghai to Genoa, which decreased $140 to $3,031. The second largest decrease was from Shanghai to Rotterdam, which decreased $66 to $2,304.
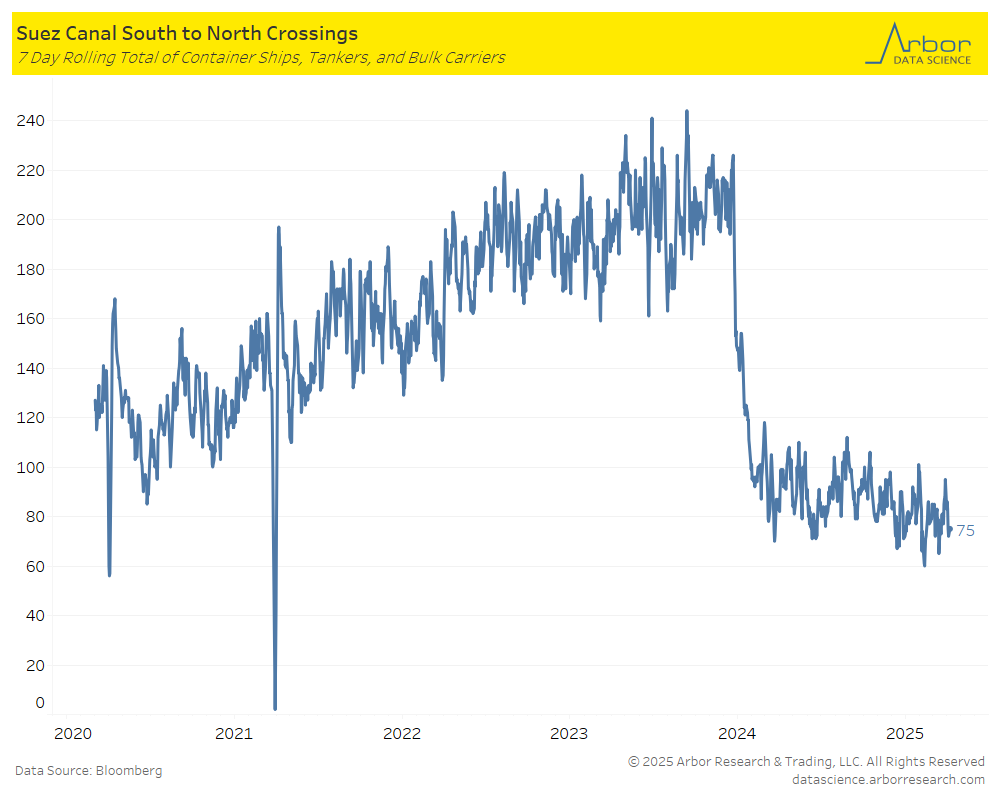
Suez Canal Crossings
- The chart below outlines the 7-day rolling total of container ships, tankers, and bulk carriers traveling South to North through the Suez Canal.
- The total number of crossings on 4/07/25 was 75 (compared to 99 on 4/08/24).
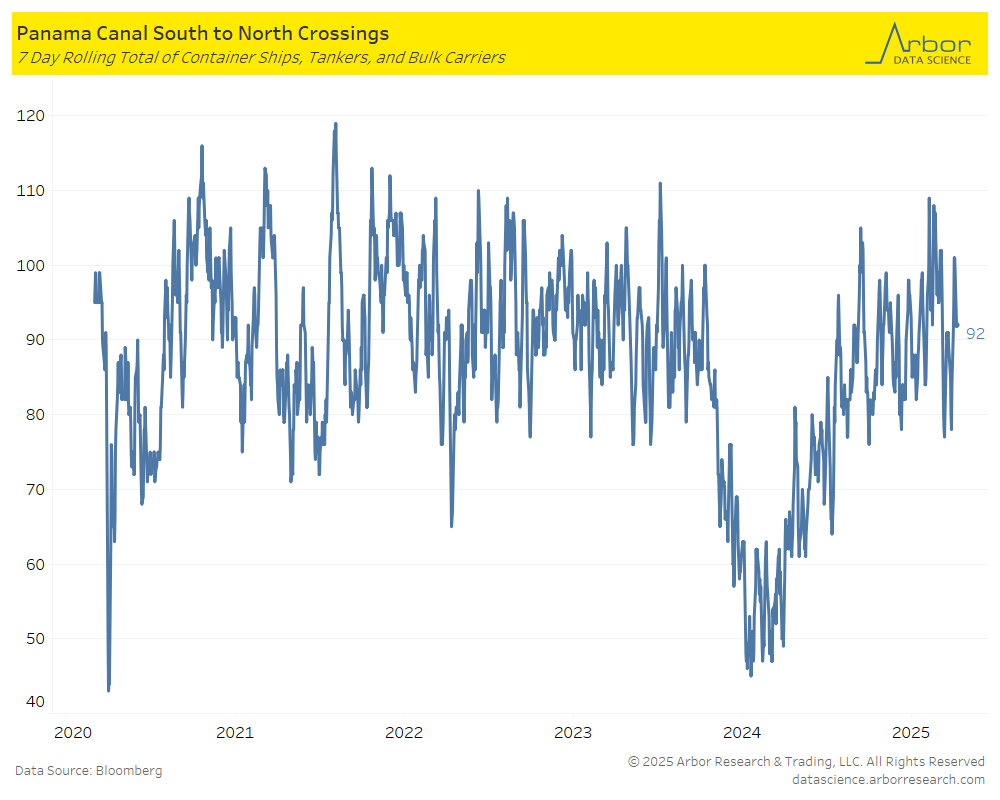
Panama Canal Crossings
- The chart below outlines the 7-day rolling total of container ships, tankers, and bulk carriers traveling South to North through the Panama Canal.
- The total number of crossings on 4/07/25 was 92 (compared to 65 on 4/08/24).
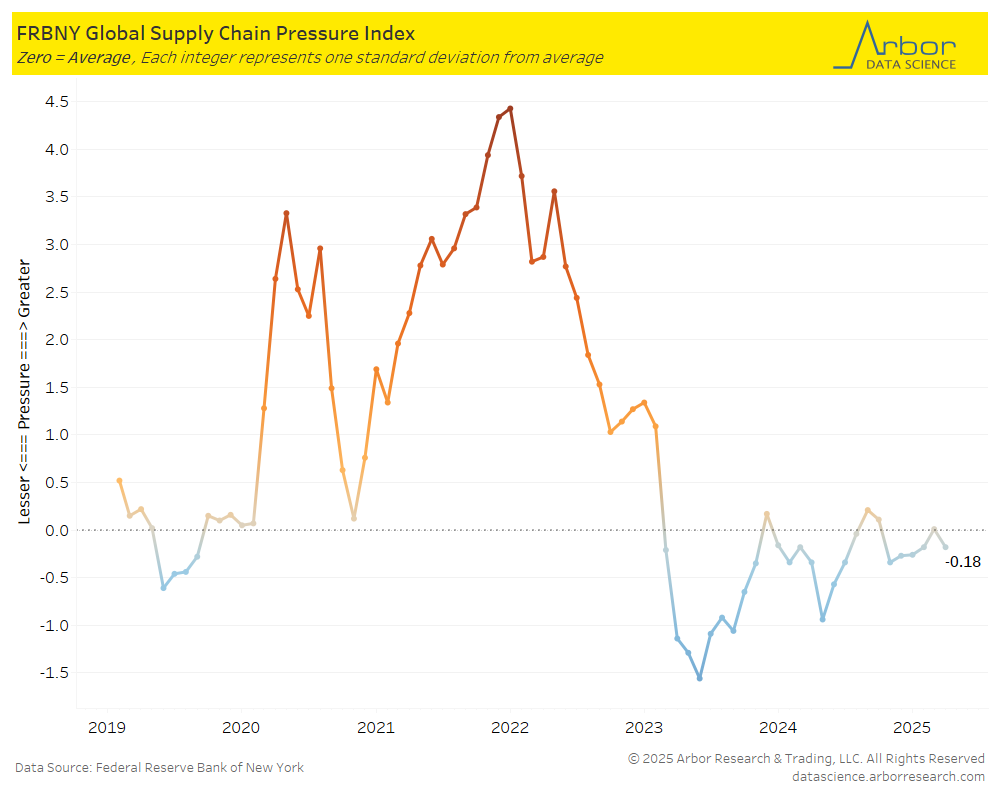
Global Supply Chain Pressure Index
- The Federal Reserve Bank of New York’s Global Supply Chain Pressure Index (GSCPI) decreased from 0.01 in February 2025 to -0.18 in March 2025.
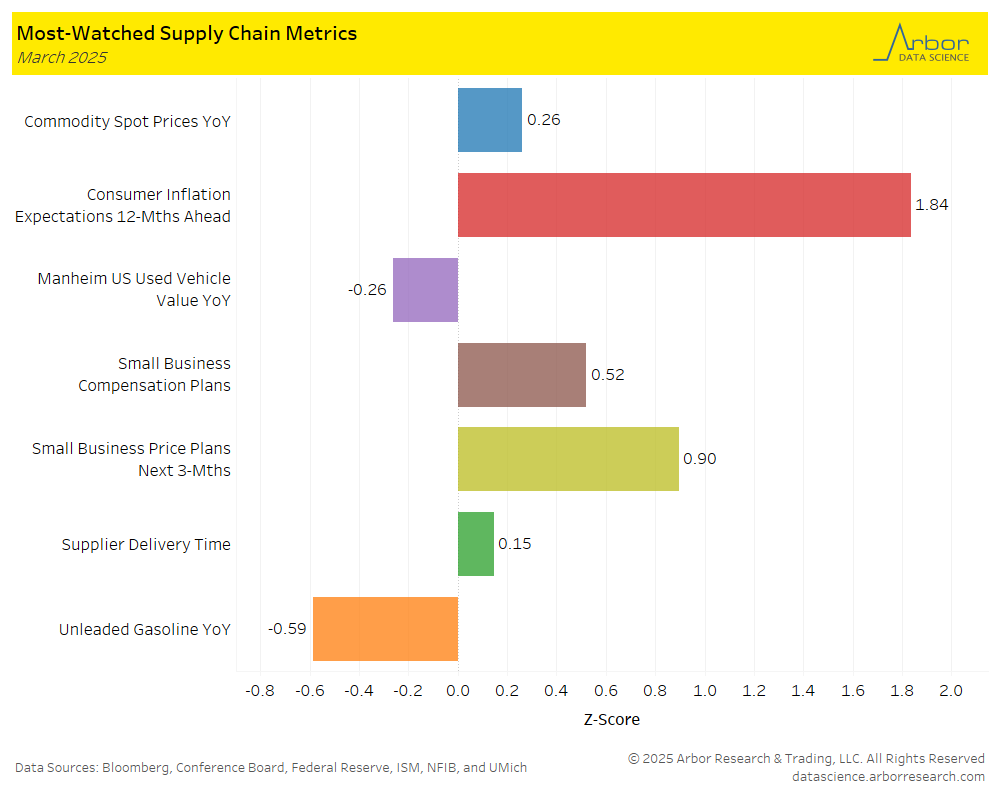
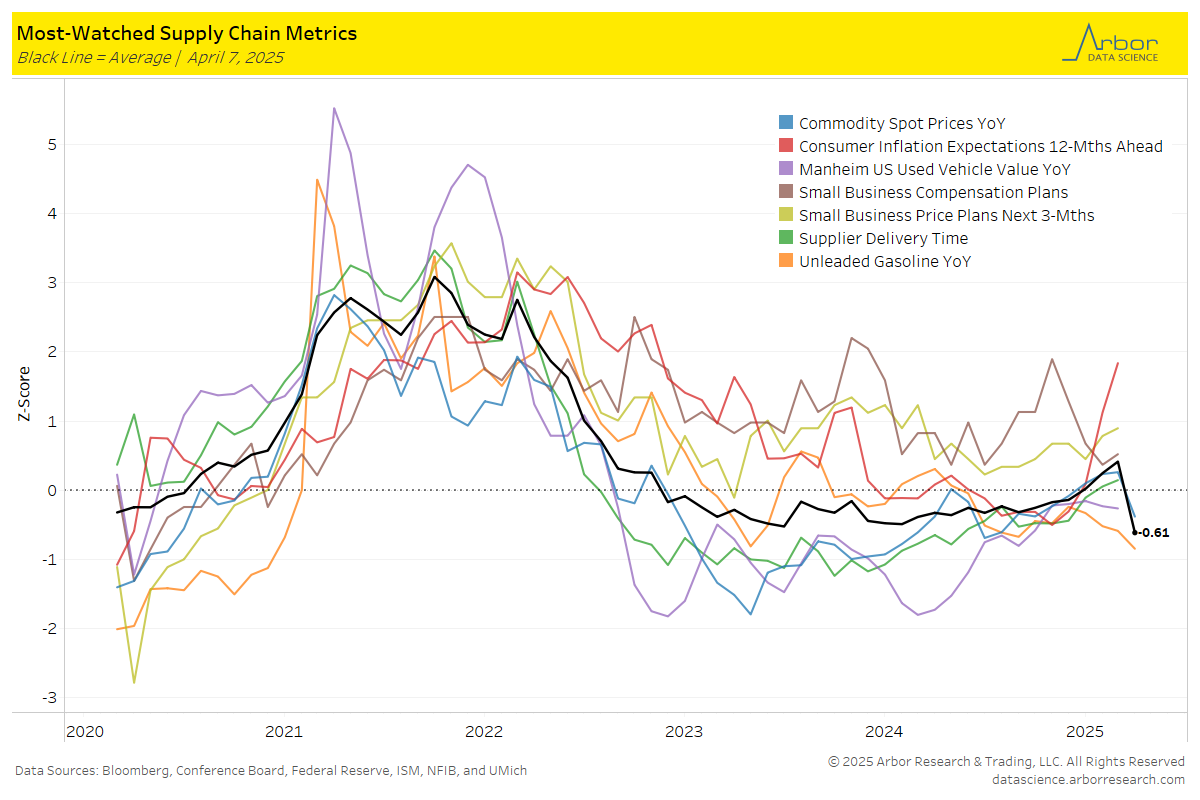
Most-Watched Supply Chain Metrics
- The chart below is a breakdown of supply chain metrics for March 2025.
- The aggregate index of most-watched supply chain metrics (the black line in the chart below) decreased last week to –0.61 from -0.57, with zero meaning the supply chain is acting normally.
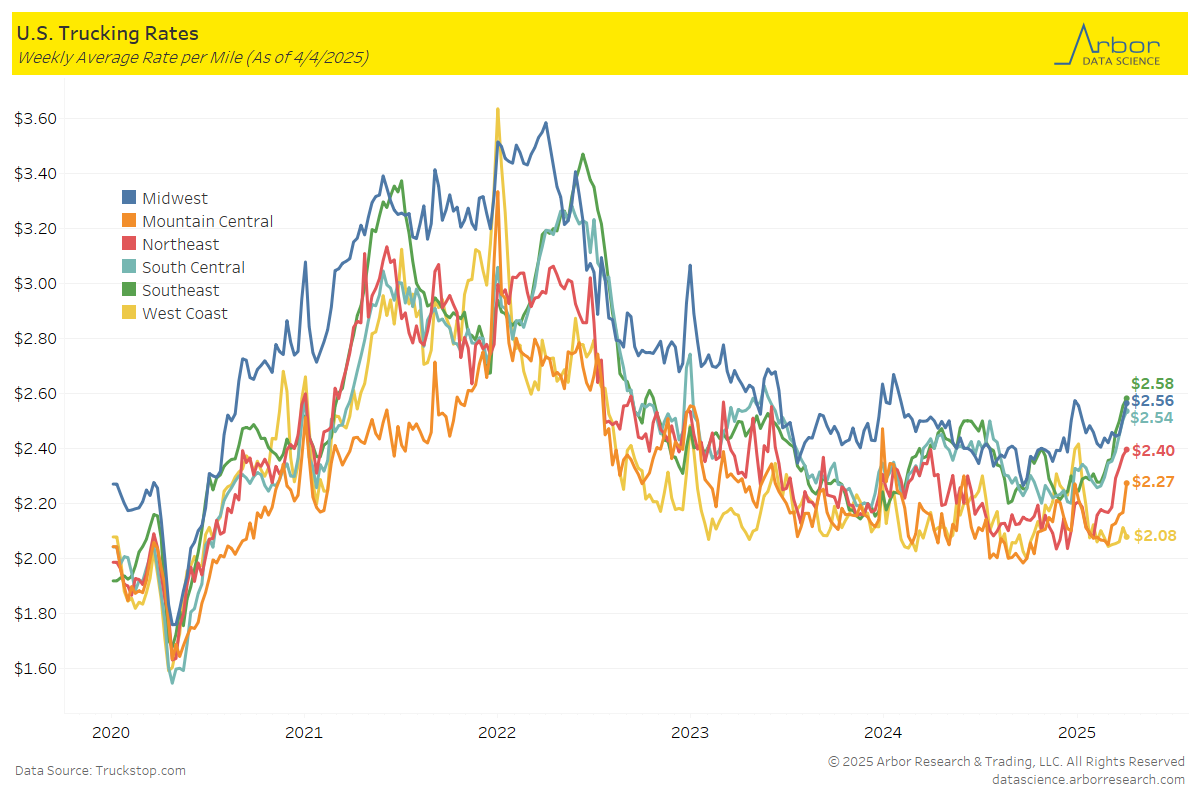
U.S. Trucking Rates
- Trucking rates increased week-over-week, with Internet Truckstop’s average equipment rate at $2.50 per mile.
- Trucking rates on a geographical basis mostly increased week-over-week. The biggest increase was in Mountain Central which increase $0.10 to $2.27 per mile, followed by the Midwest which increased $0.05 to $2.56 per mile. The only decrease was in the West Coast which decreased -$0.03 to $2.08 per mile.
Tables