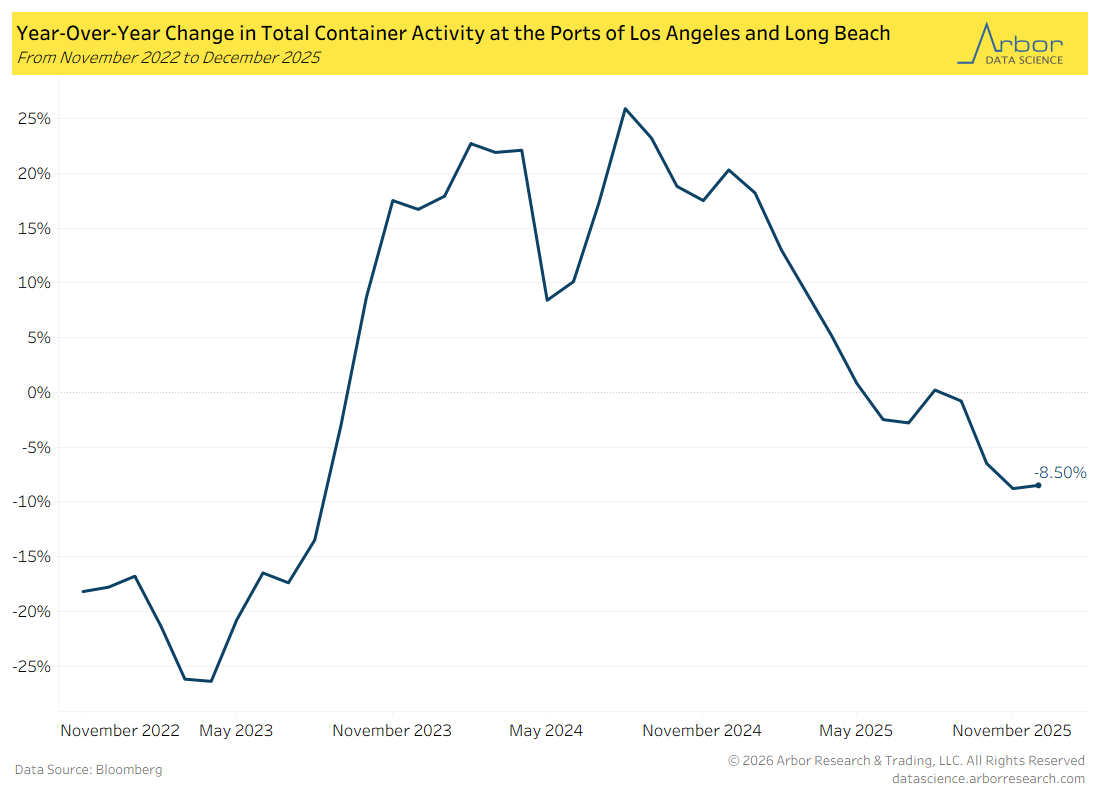
Decreased Container Volume at the Ports of L.A. and Long Beach
- The ports of Los Angeles and Long Beach, which are among the busiest in the U.S., had a year-over-year decrease of 8.50% in terms of container traffic in December 2025. This includes both imports and exports.
- Driven by trade tensions, tariff uncertainties and a pause in shipments from China, container activity declined from August 2025 to December 2025.
- The only month since December 2024 to have a year-over-year increase was August 2025, at 0.02%.
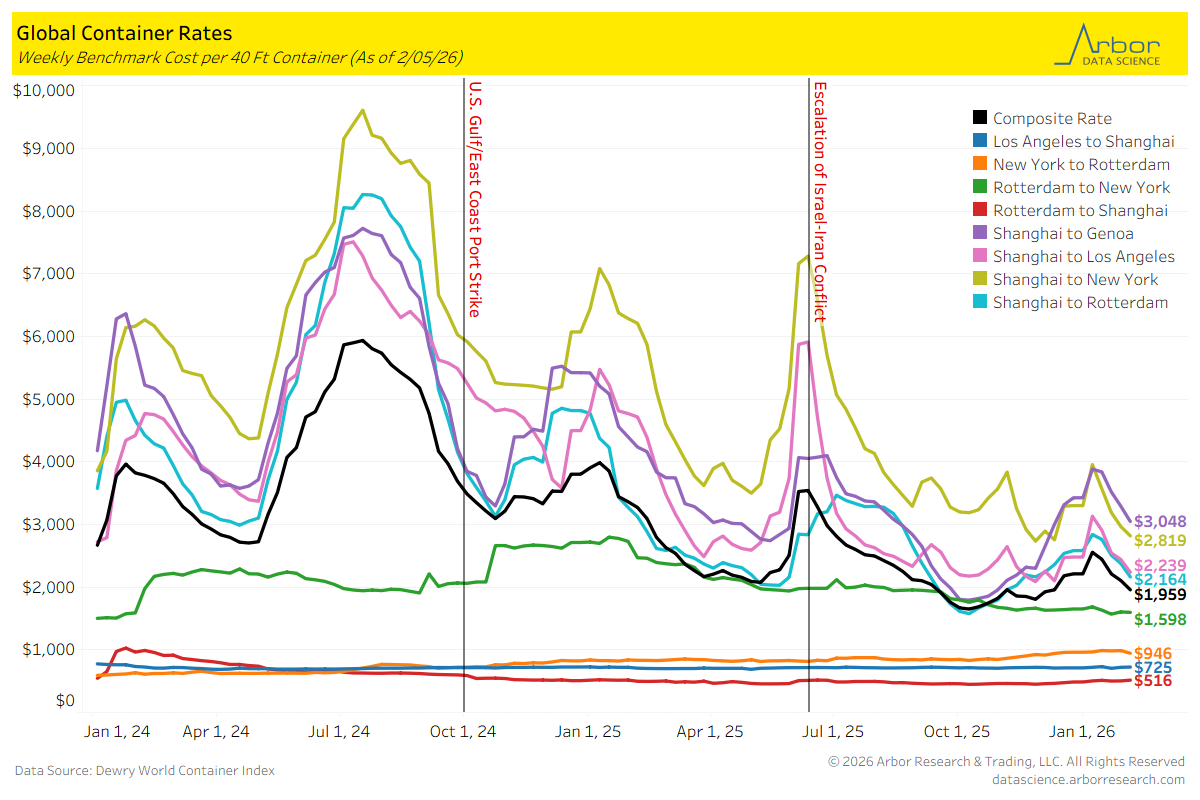
Global Container Rates
- The composite rate per 40-foot container was $1,959 on 2/05/2026, which is down $148 from 1/29/2026. Global container rates mostly declined from 1/29/2026 to 2/06/2026. The largest decrease was from Shanghai to Genoa which decreased $245 to $3,048. The second-largest decrease was from Shanghai to Rotterdam, which decreased $215 to $2,164.
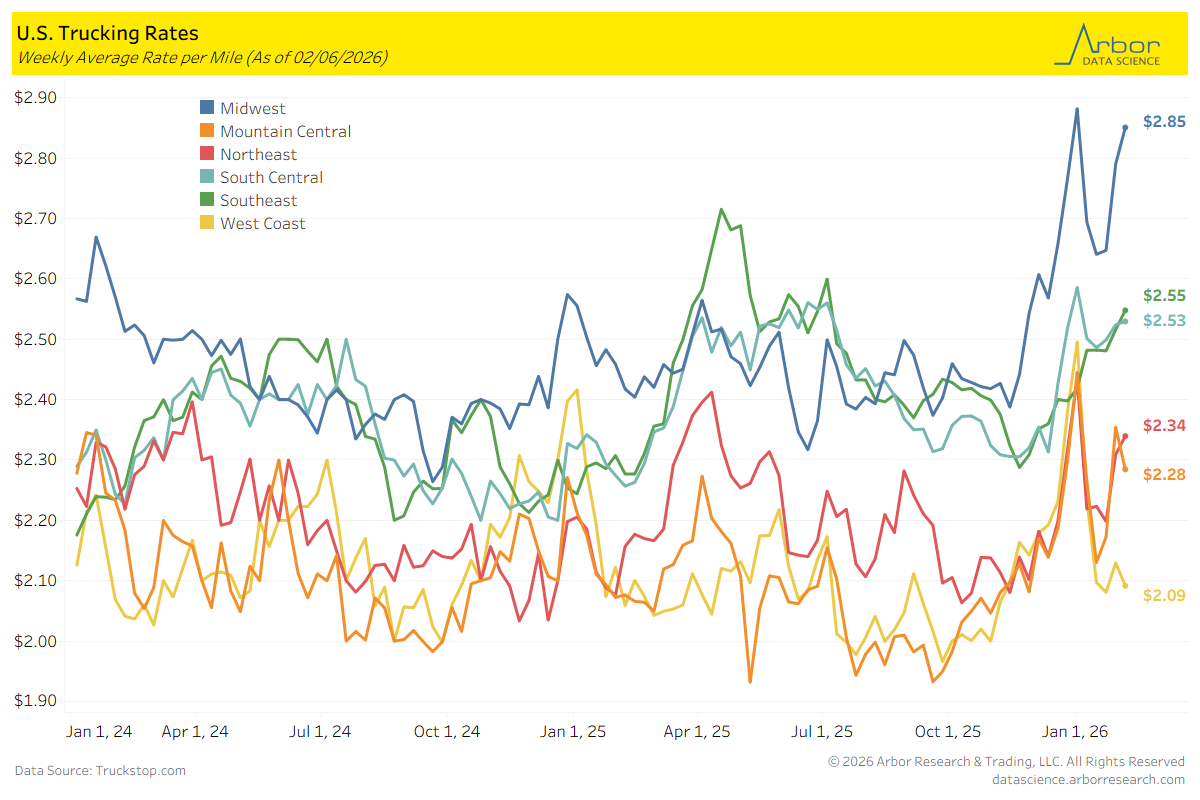
U.S. Trucking Rates
- The Internet Trucks Spot Average Equipment rate was $2.54 per mile as of 02/06/2026.
- Trucking rates on a geographical basis was mixed over the past week. The rate for the Midwest region had the largest increase by $0.06 per mile. The rate for the Mountain Central region had the largest decrease by $0.07 per mile.
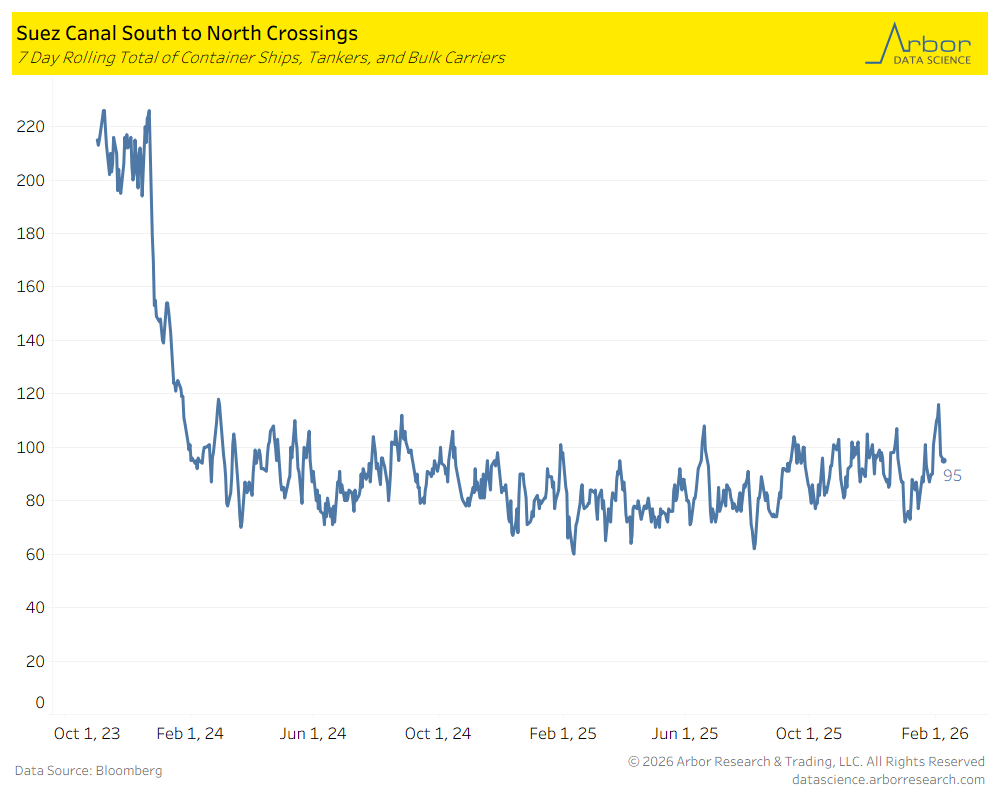
Suez Canal Crossings
- The chart below outlines the 7-day rolling total of container ships, tankers, and bulk carriers traveling South to North through the Suez Canal.
- The total number of crossings on 02/09/2026 was 95 (compared to 74 on 02/06/2025 and 95 on 02/10/2024).
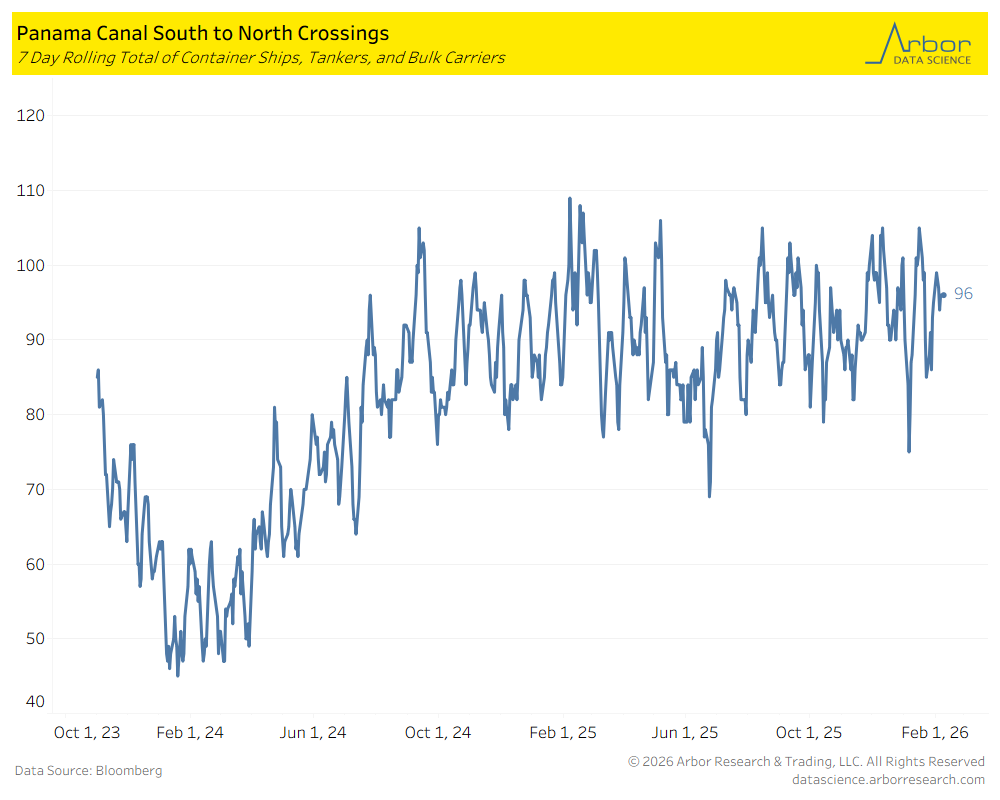
Panama Canal Crossings
- The chart below outlines the 7-day rolling total of container ships, tankers, and bulk carriers traveling South to North through the Panama Canal.
- The total number of crossings on 02/09/2026 was 96 (compared to 100 on 02/06/2025).
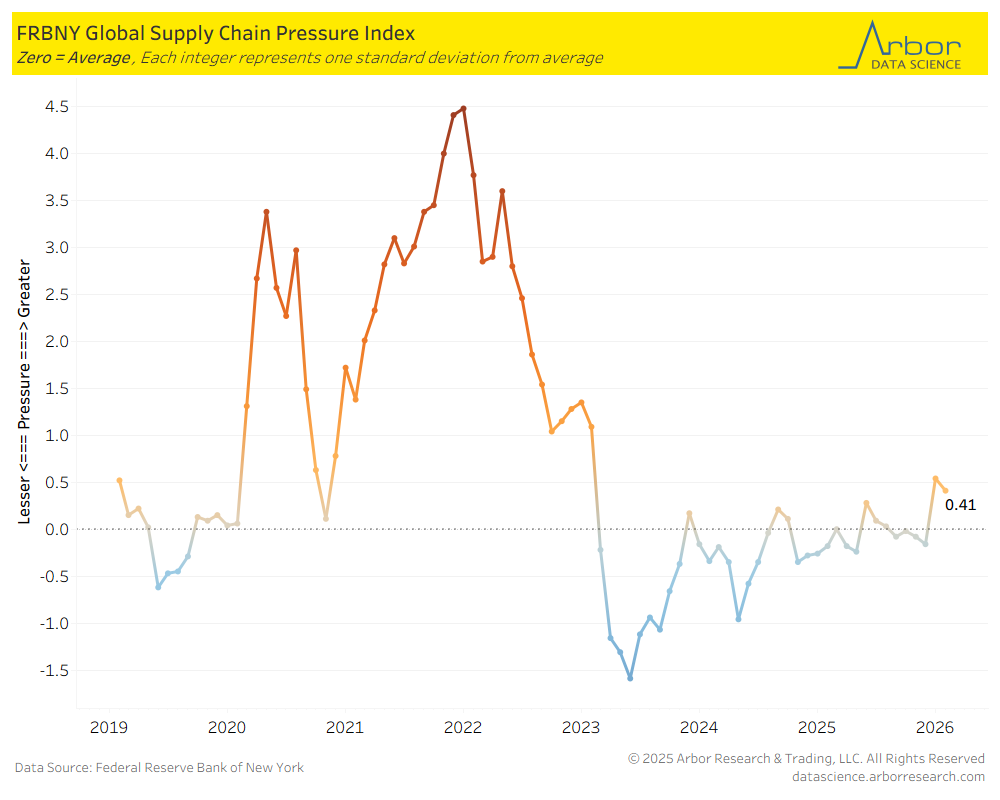
Global Supply Chain Pressure Index
- The Federal Reserve Bank of New York’s Global Supply Chain Pressure Index (GSCPI) decreased from 0.54 in December 2025 to 0.41 for January 2026.
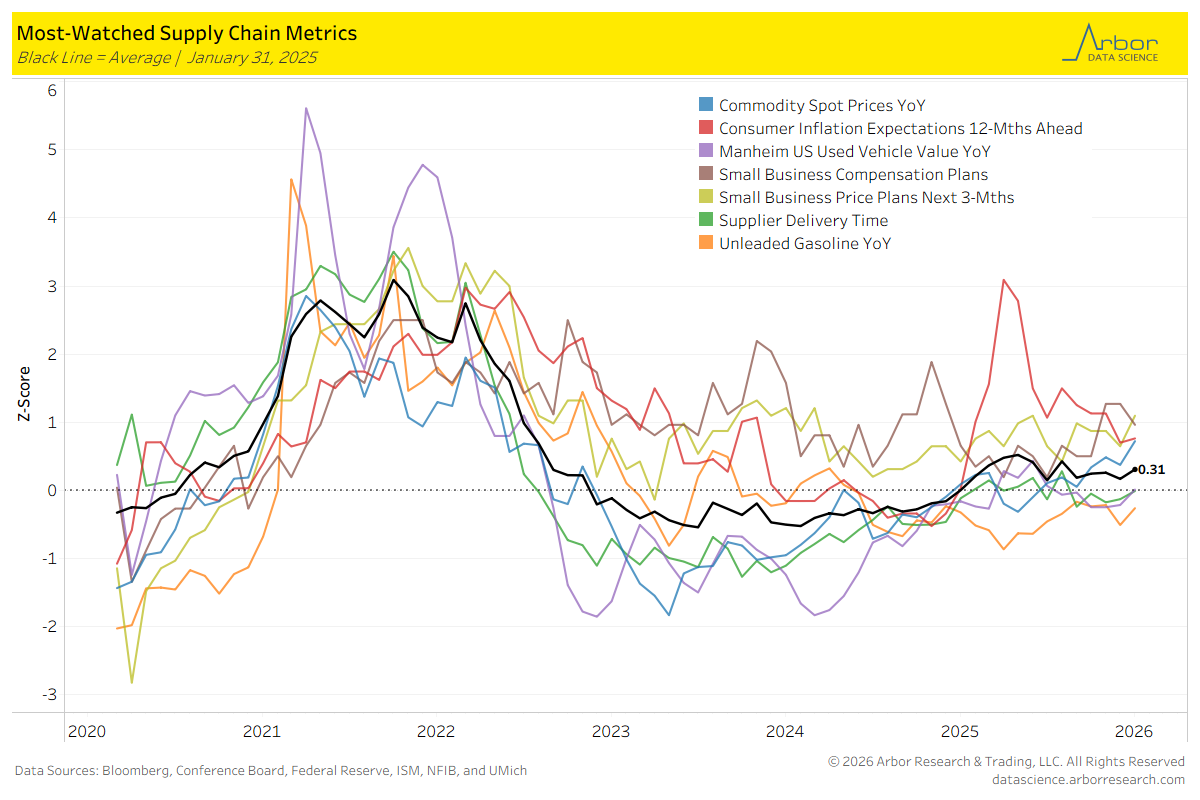
Most-Watched Supply Chain Metrics
- The chart below is a breakdown of supply chain metrics for January 2026.
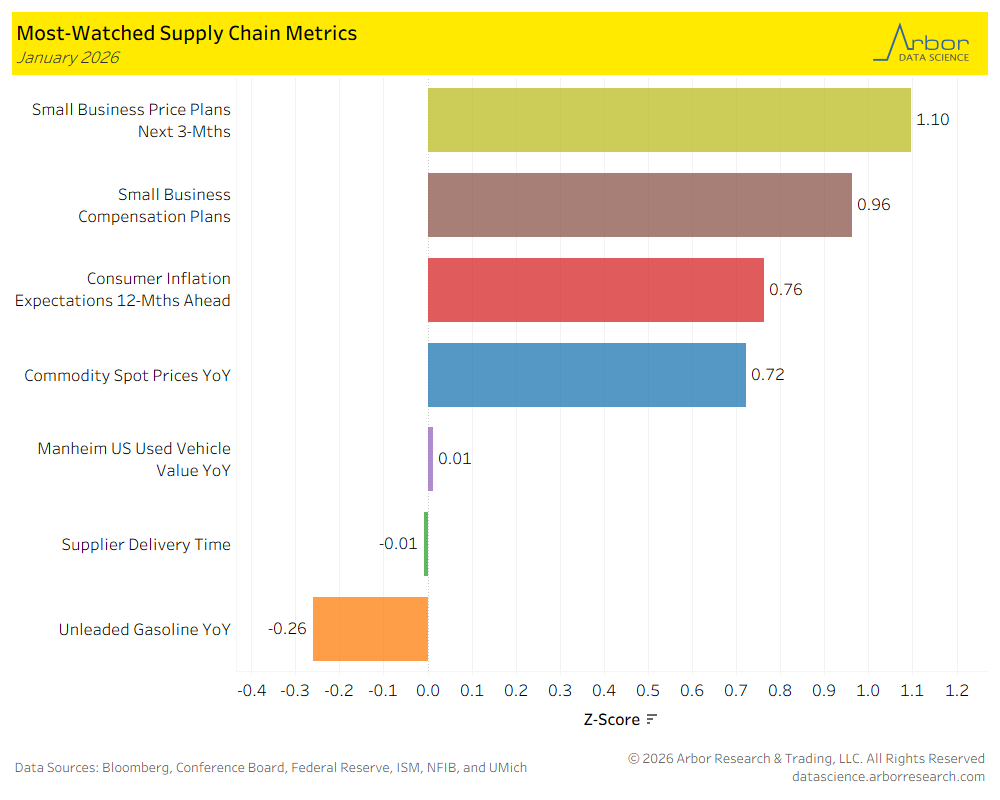
- The aggregate index of most-watched supply chain metrics (the black line in the chart below) was 0.31, with zero meaning the supply chain is acting normally.
Tables