In Recent Supply Chain News:
- In their first attacks since November 2024, Houthi Rebels sank one cargo ship on 7/6/2025 and attacked another on 7/7/2025. Both attacks took place in the Red Sea off the Coast of Yemen.
- A heatwave across Europe has resulted in low water levels on Danube River. The second-largest river in Europe is crucial for the movement of goods across the continent, and these low levels of water make it impossible for ships to operate at full capacity.
- President Trump announced new tariff rates for multiple countries on 7/7/2025, with the levies expected to come into effect on 8/1/2025
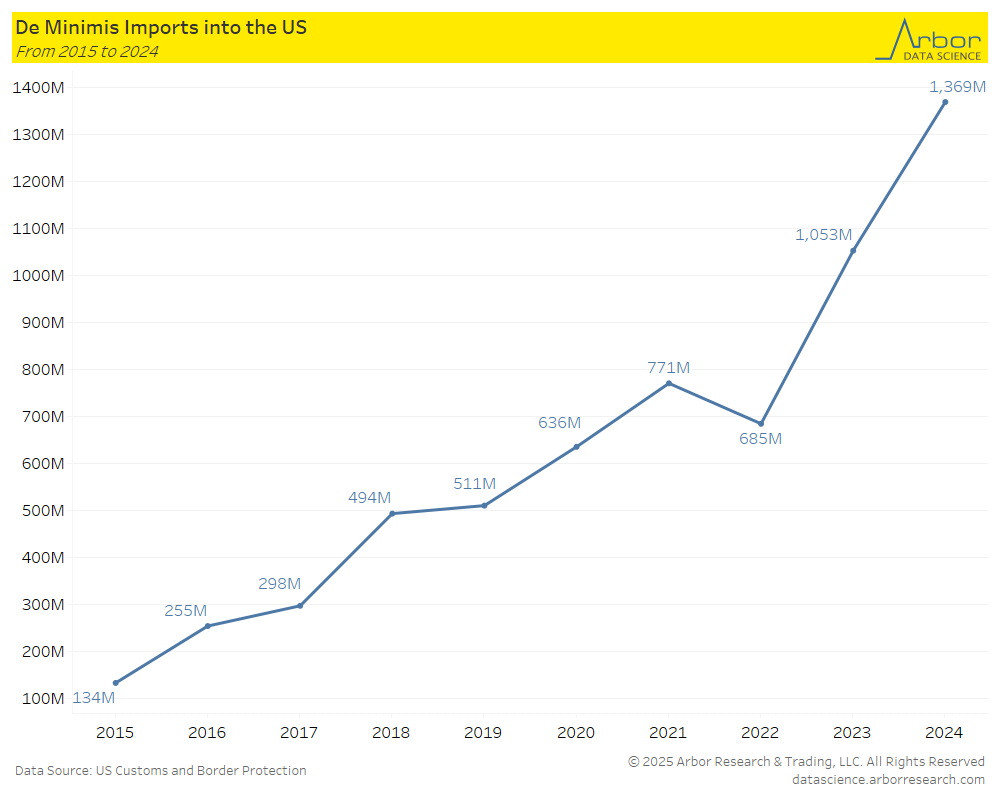
- The de minimis exemption, which allowed goods valued less than $800 to enter the U.S. without taxies or levies, will end in 2027. This exemption had allowed for online budget importers like Shein and Temu to flood the U.S. market with cheap clothing and plastic goods.
- There were $1.369 billion worth of imports falling within the de minimis exemption in 2024, more than ten times the $134 million in 2015.
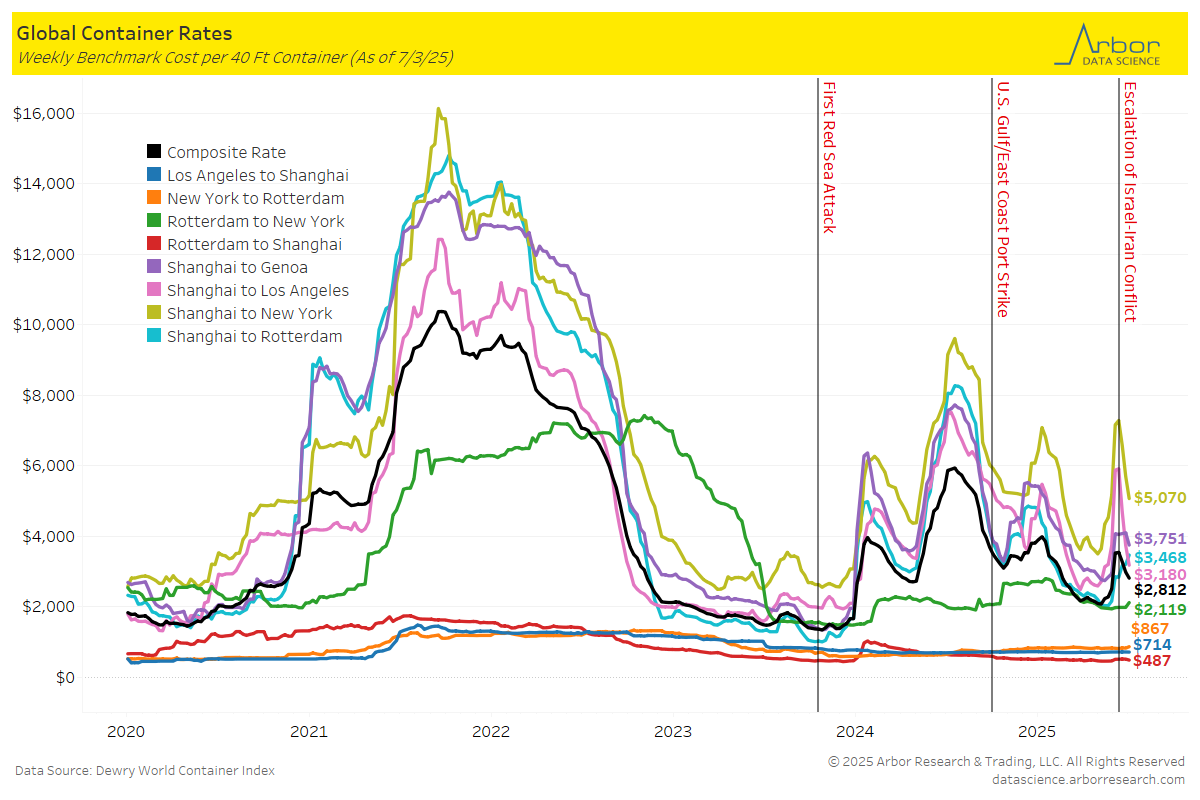
Global Container Rates
- The composite rate per 40-foot container was $2,812 on 7/3/25, which is down $171 from the previous week. Global container rates were mixed week-over-week. The largest decrease was from Shanghai to New York, which decreased $633 to $5,070. The second-largest decrease was from Shanghai to Los Angeles, which decreased $561 to $3,180.
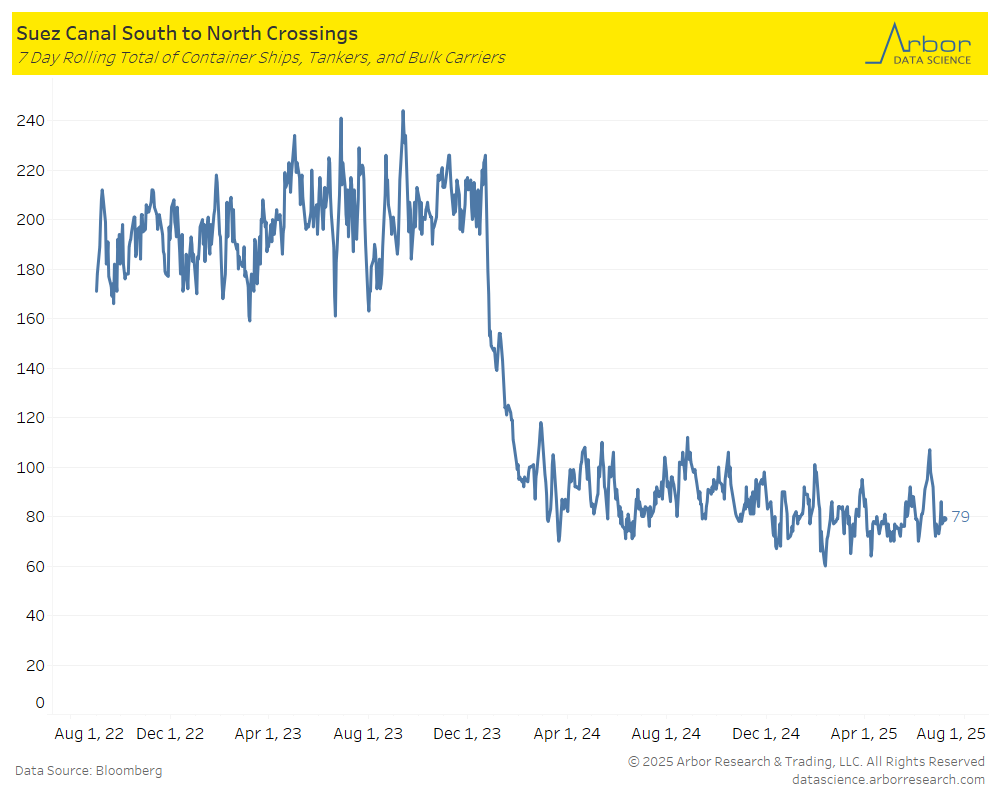
Suez Canal Crossings
- The chart below outlines the 7-day rolling total of container ships, tankers, and bulk carriers traveling South to North through the Suez Canal.
- The total number of crossings on 7/7/25 was 79 (compared to 83 on 7/8/24 and 193 on 7/7/2023).
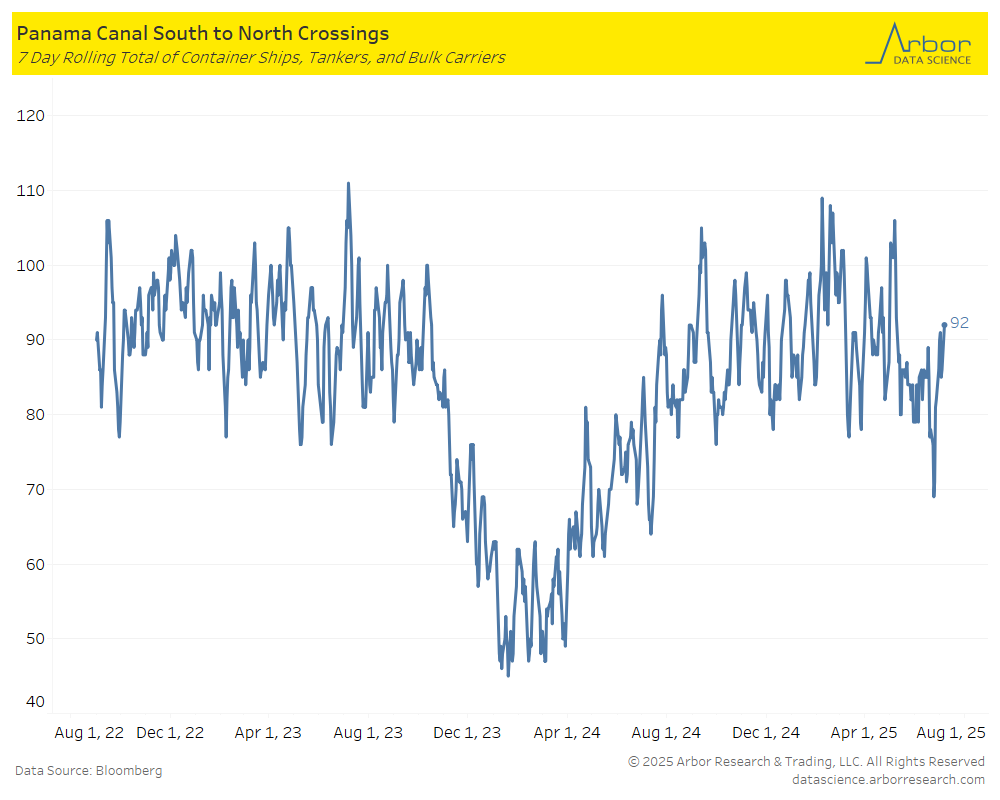
Panama Canal Crossings
- The chart below outlines the 7-day rolling total of container ships, tankers, and bulk carriers traveling South to North through the Panama Canal.
- The total number of crossings on 7/7/25 was 92 (compared to 73 on 7/8/24).
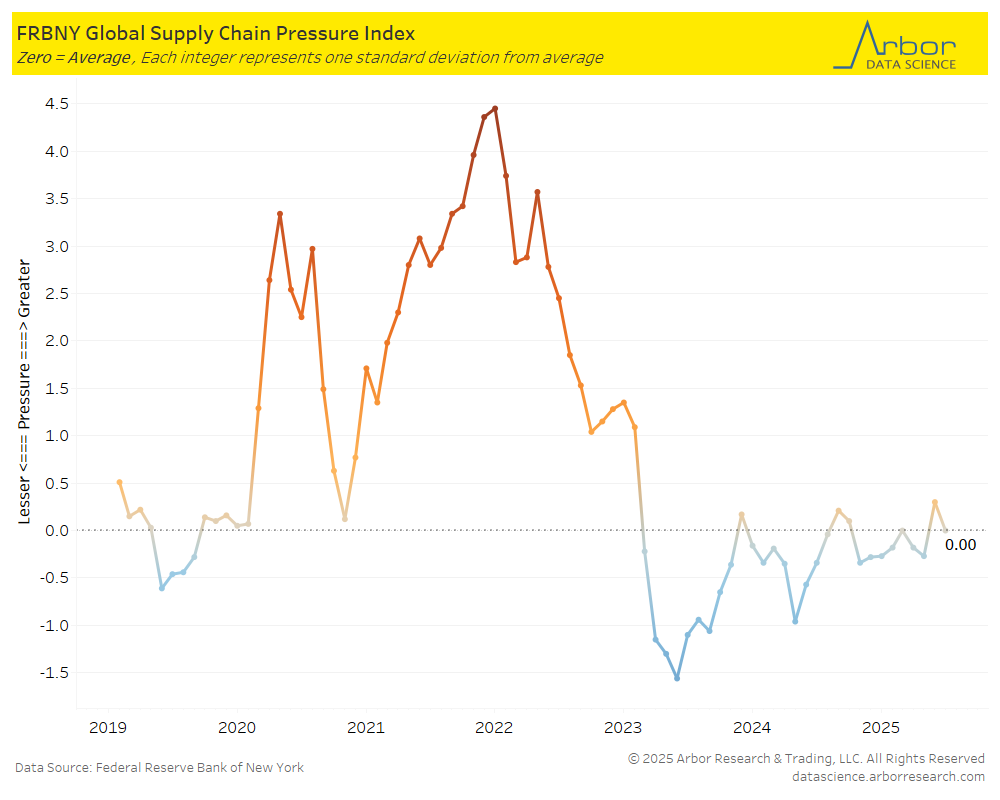
Global Supply Chain Pressure Index
- The Federal Reserve Bank of New York’s Global Supply Chain Pressure Index (GSCPI) decreased from 0.30 in May 2025 to 0.00 in June 2025.
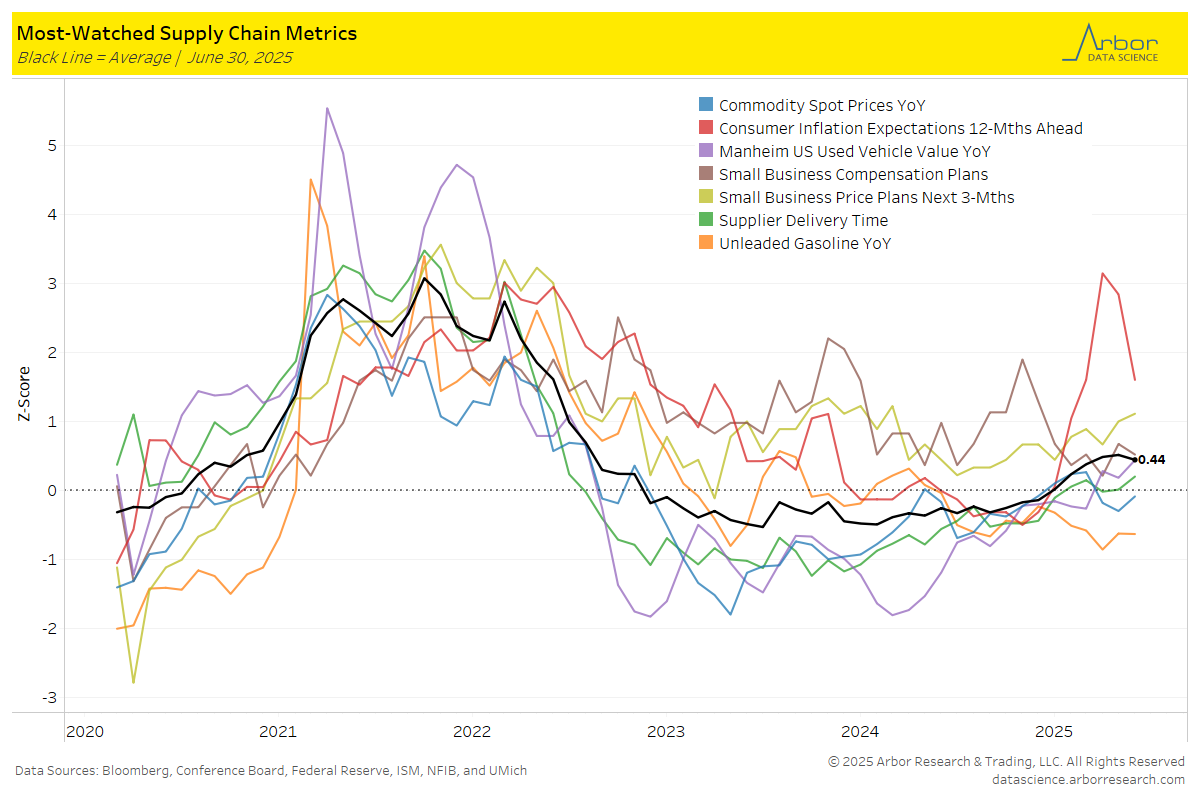
Most-Watched Supply Chain Metrics
- The chart below is a breakdown of supply chain metrics for June 2025.
.png)
- The aggregate index of most-watched supply chain metrics (the black line in the chart below) was 0.44, with zero meaning the supply chain is acting normally.
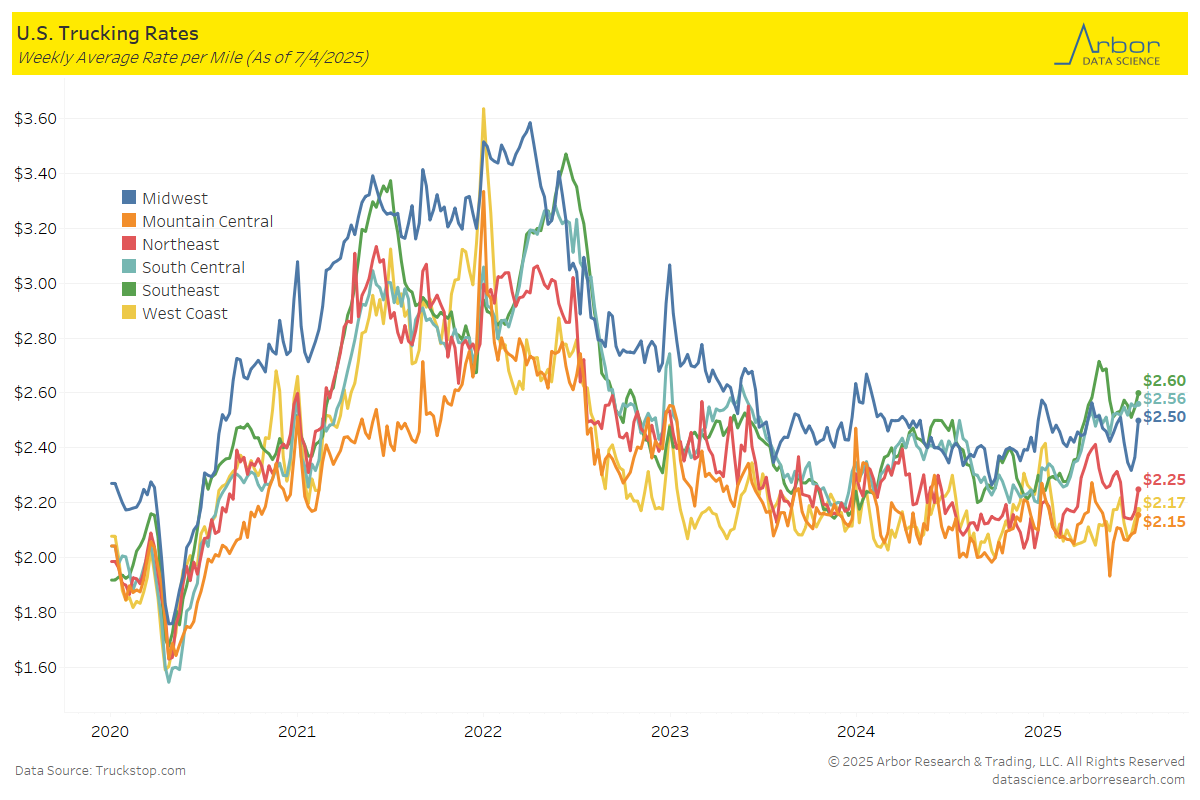
U.S. Trucking Rates
- Trucking rates increased week-over-week, with Internet Truckstop’s average equipment rate at $2.49 per mile.
- Trucking rates on a geographical basis increased last week. The largest increase was in the Midwest region which increased $0.14 to $2.50 per mile. The second-largest increase was in the Northeast region which increased $0.08 to $2.25 per mile.

Tables