In Recent News:
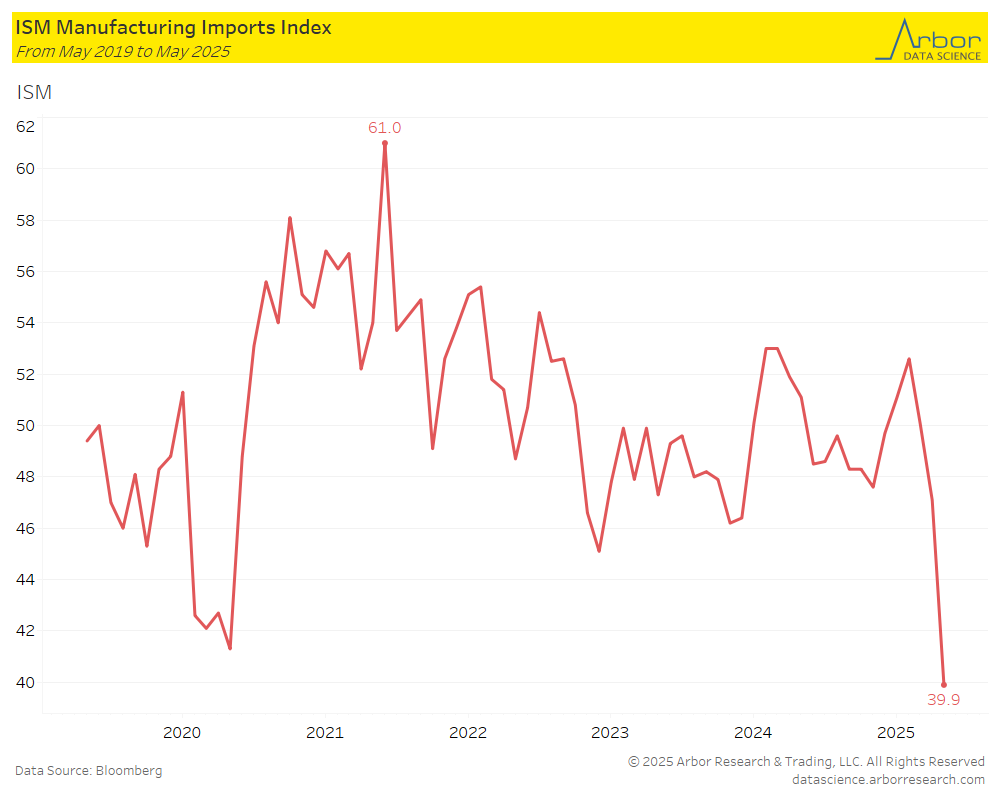
ISM Imports Index Drops
- The manufacturing imports index from the Institute for Supply Management fell to 39.9 in May 2025. This was the second month in a row with a value below 50 (April was 47.1), which indicates a contraction.
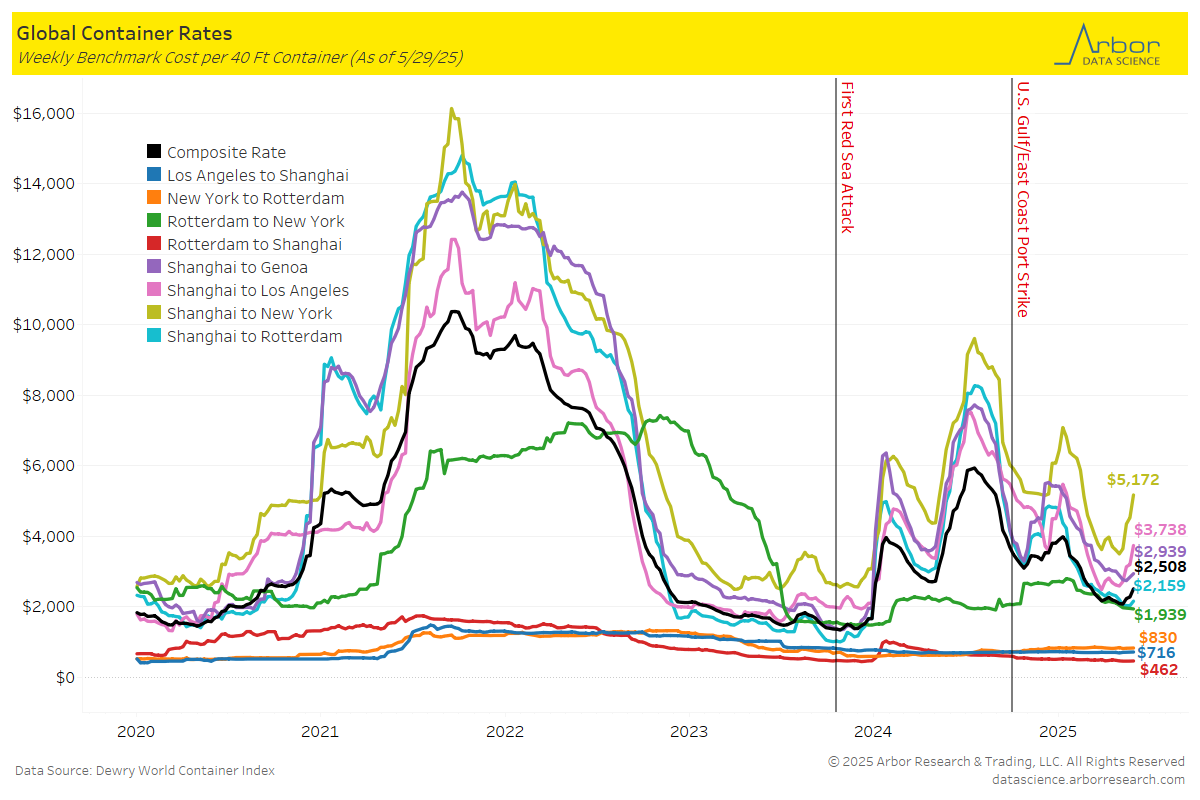
Global Container Rates
- The composite rate per 40-foot container was $2,508 on 5/29/25, which is up $232 from the previous week. Global container rates mostly increased week-over-week. The largest increase was from Shanghai to New York, which increased $645 to $5,172. The second largest increase was from Shanghai to Genoa, which increased $541 to $3,738.
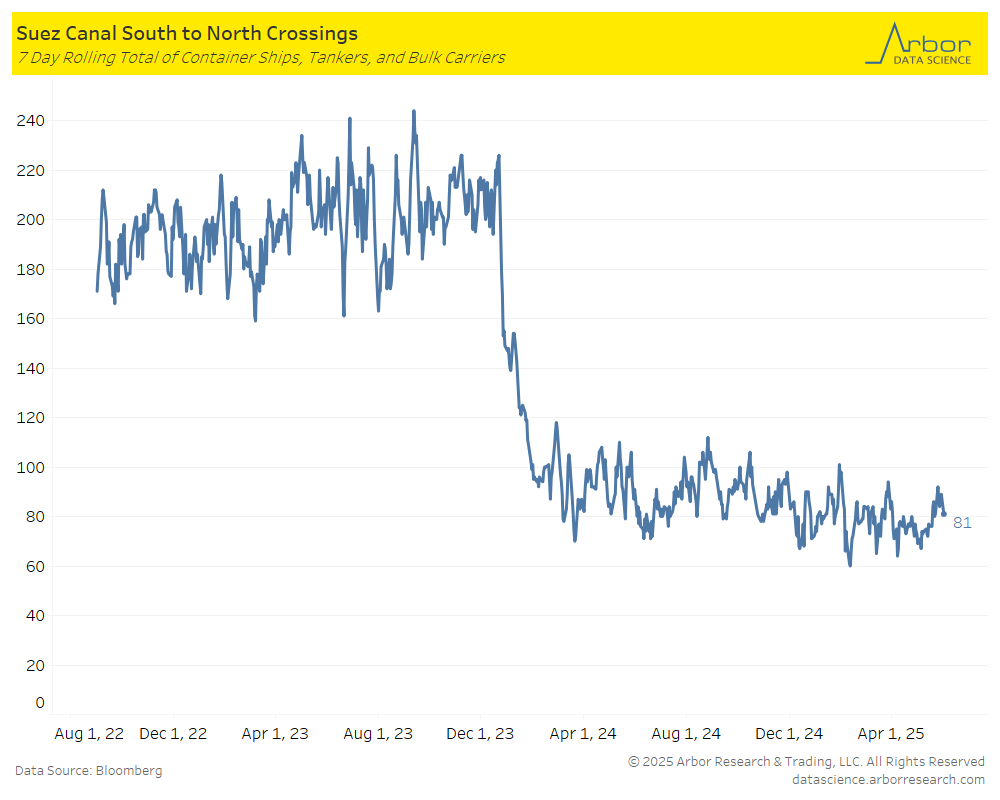
Suez Canal Crossings
- The chart below outlines the 7-day rolling total of container ships, tankers, and bulk carriers traveling South to North through the Suez Canal.
- The total number of crossings on 6/2/25 was 81 (compared to 80 on 6/3/24).
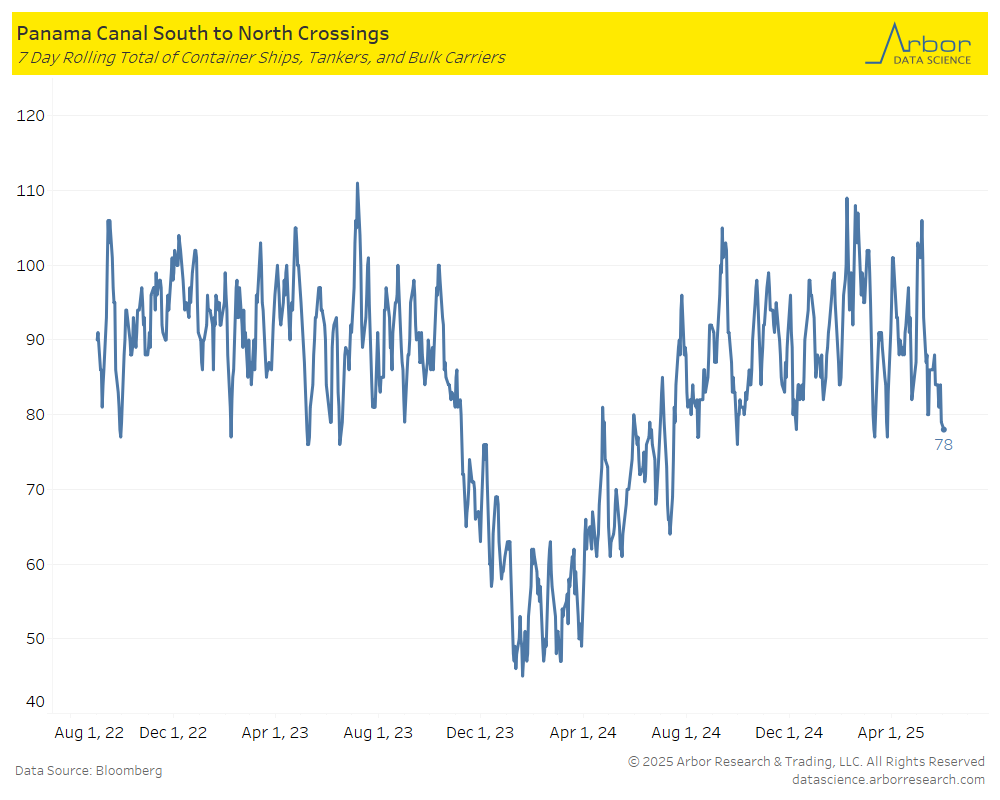
Panama Canal Crossings
- The chart below outlines the 7-day rolling total of container ships, tankers, and bulk carriers traveling South to North through the Panama Canal.
- The total number of crossings on 6/2/25 was 78 (compared to 76 on 6/3/24).
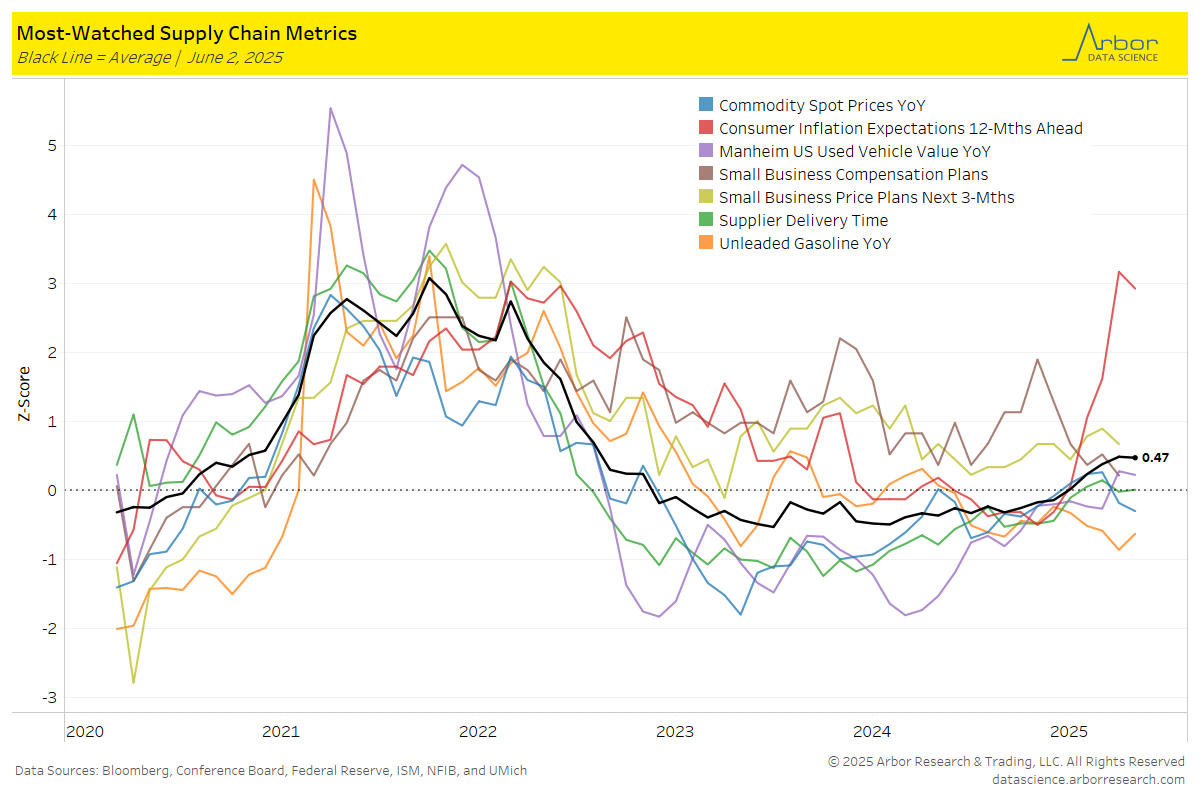
Most-Watched Supply Chain Metrics
- The chart below is a breakdown of supply chain metrics for April 2025.
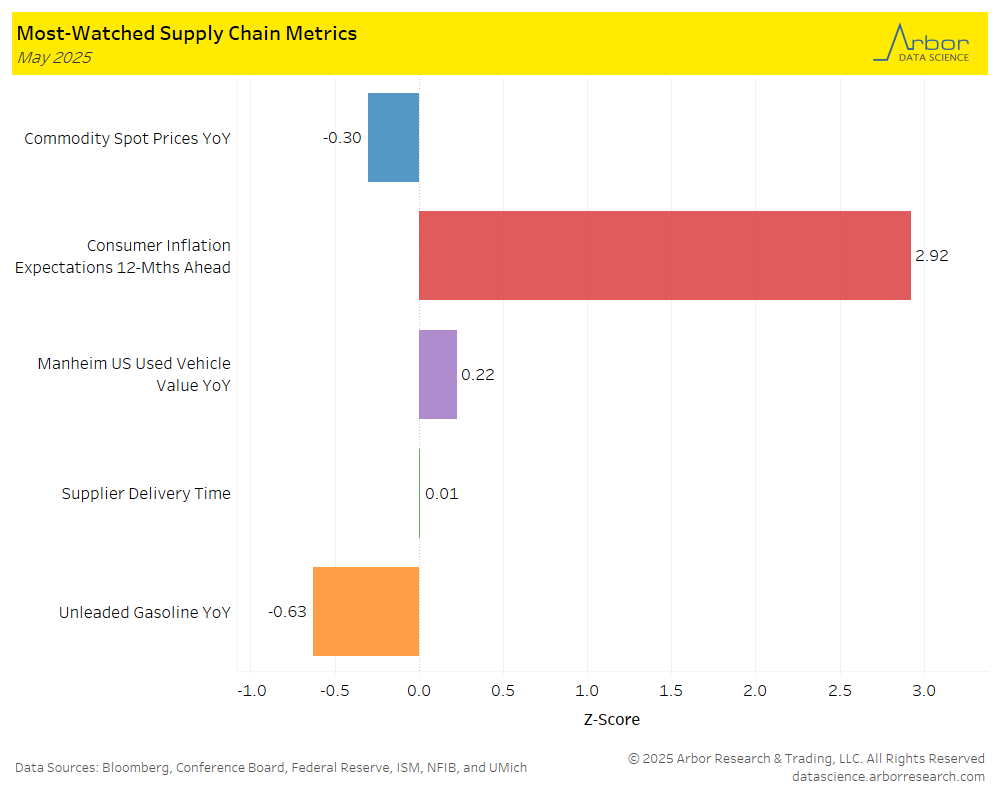
- The aggregate index of most-watched supply chain metrics (the black line in the chart below) was 0.47, with zero meaning the supply chain is acting normally.
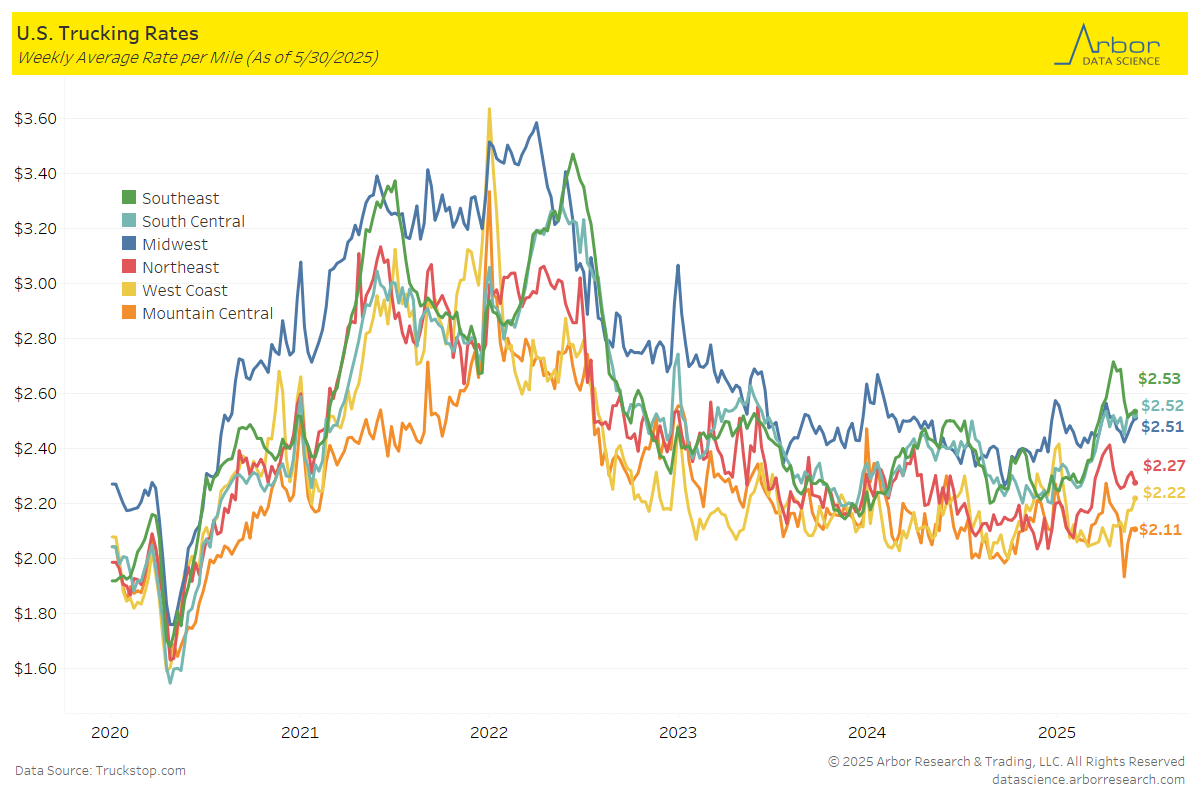
U.S. Trucking Rates
- Trucking rates increased week-over-week, with Internet Truckstop’s average equipment rate at $2.46 per mile.
- Trucking rates on a geographical basis was mixed last week. The largest increase was in West Coast which increased $0.05 to $2.22 per mile. The largest decrease was in the Northeast which decreased $0.04 to $2.27 per mile.

Tables