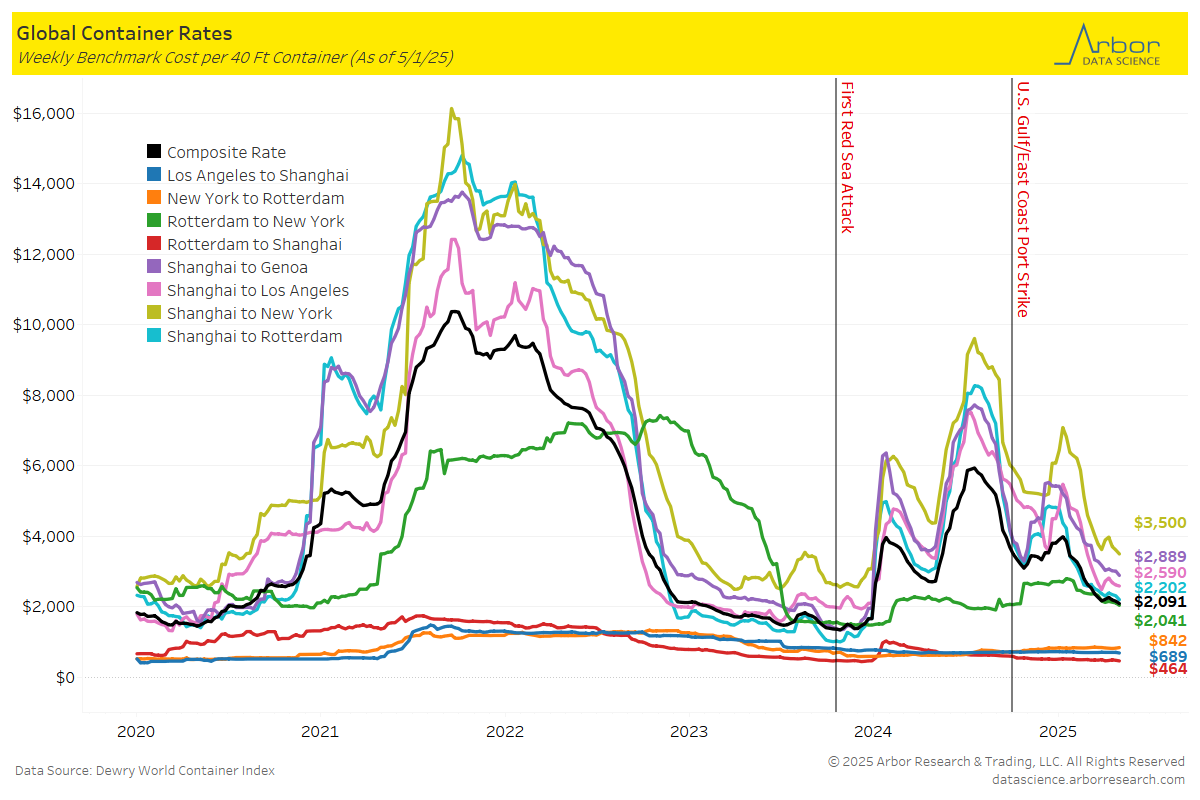
Global Container Rates
- The composite rate per 40-foot container was $2,091 on 5/1/25, which is down $66 from the previous week. Global container rates mostly decreased week-over-week. The largest decrease was from Shanghai to Genoa, which decreased $123 to $2,889. The second largest decrease was from Shanghai to New York, which decreased $111 to $3,500.
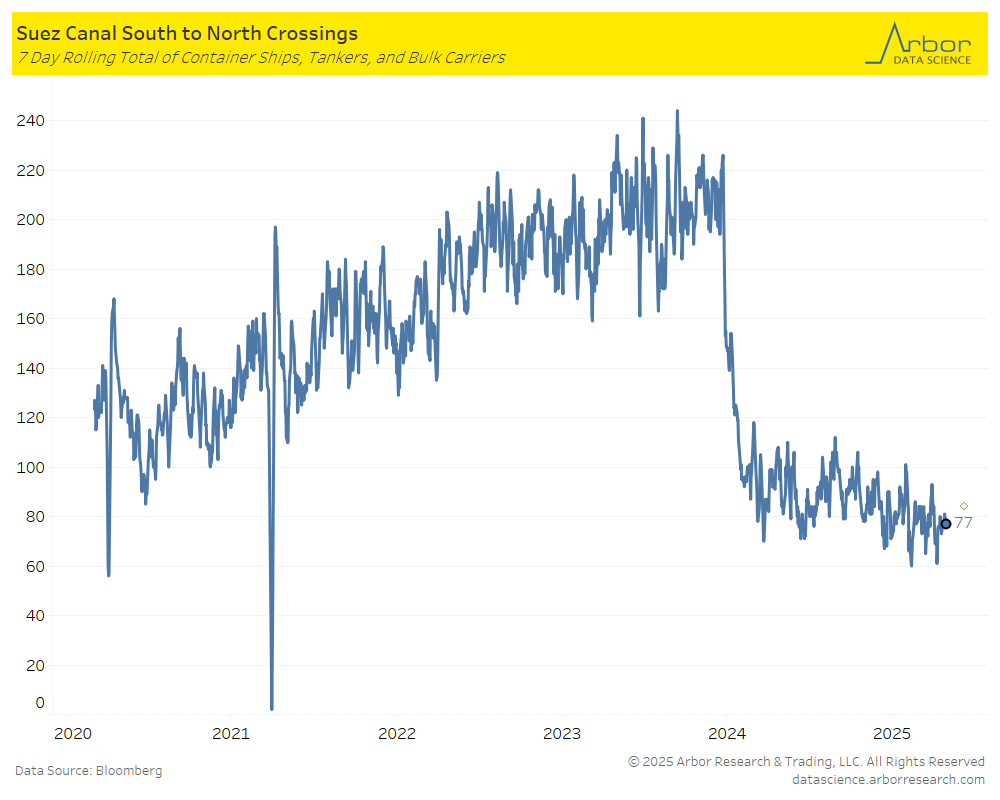
Suez Canal Crossings
- The chart below outlines the 7-day rolling total of container ships, tankers, and bulk carriers traveling South to North through the Suez Canal.
- The total number of crossings on 5/6/25 was 60 (compared to 86 on 5/6/24).
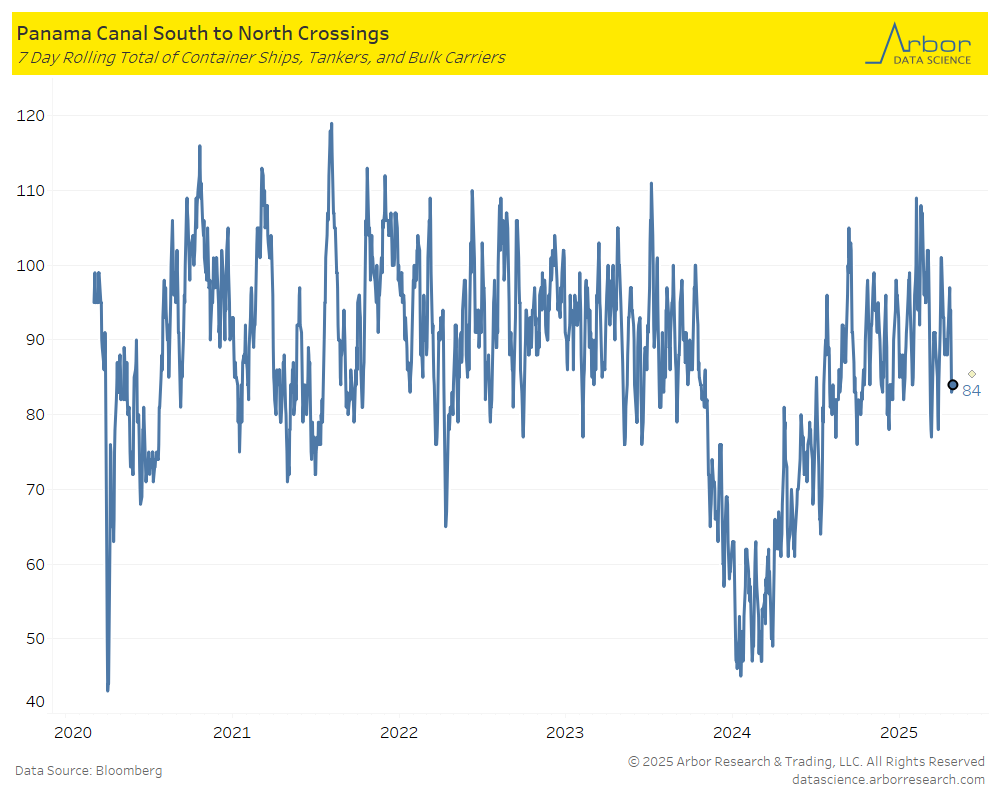
Panama Canal Crossings
- The chart below outlines the 7-day rolling total of container ships, tankers, and bulk carriers traveling South to North through the Panama Canal.
- The total number of crossings on 5/6/25 was 91 (compared to 64 on 5/6/24).
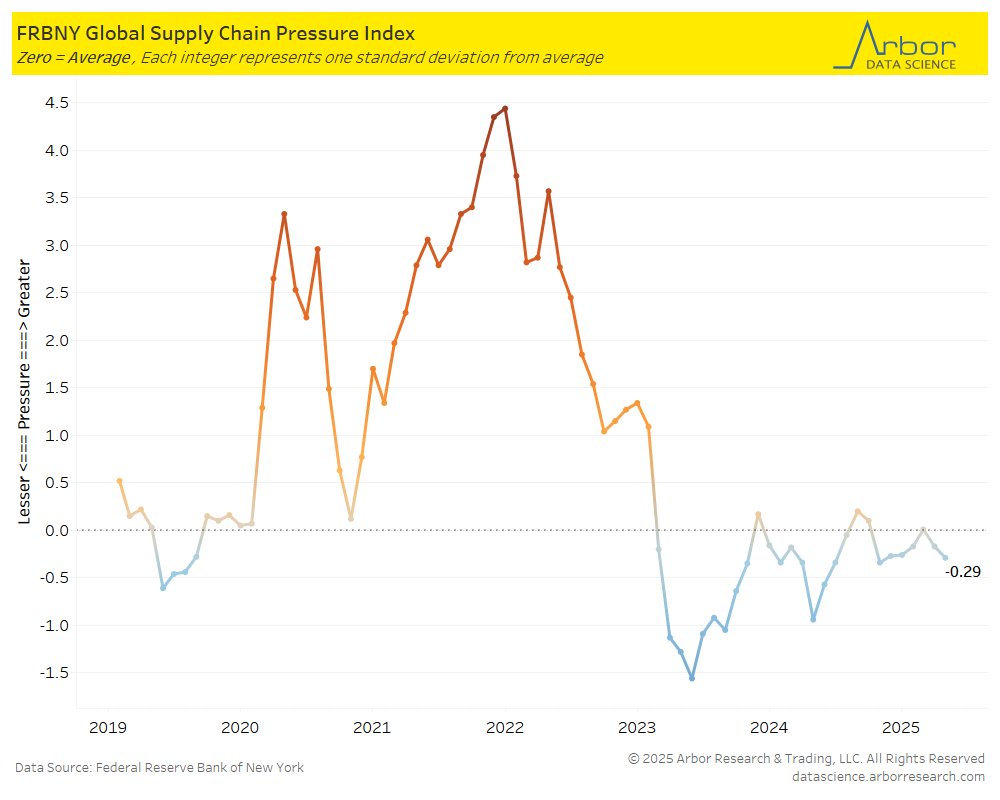
Global Supply Chain Pressure Index
- The Federal Reserve Bank of New York’s Global Supply Chain Pressure Index (GSCPI) decreased from -0.17 in March 2025 to -0.29 in April 2025.
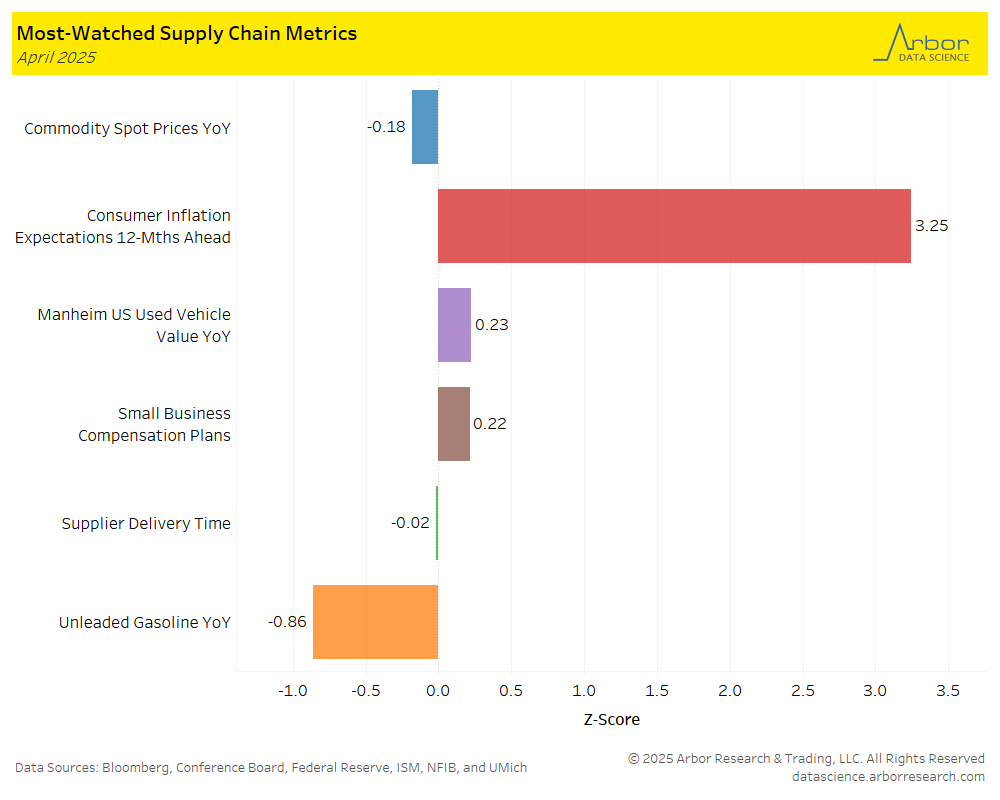
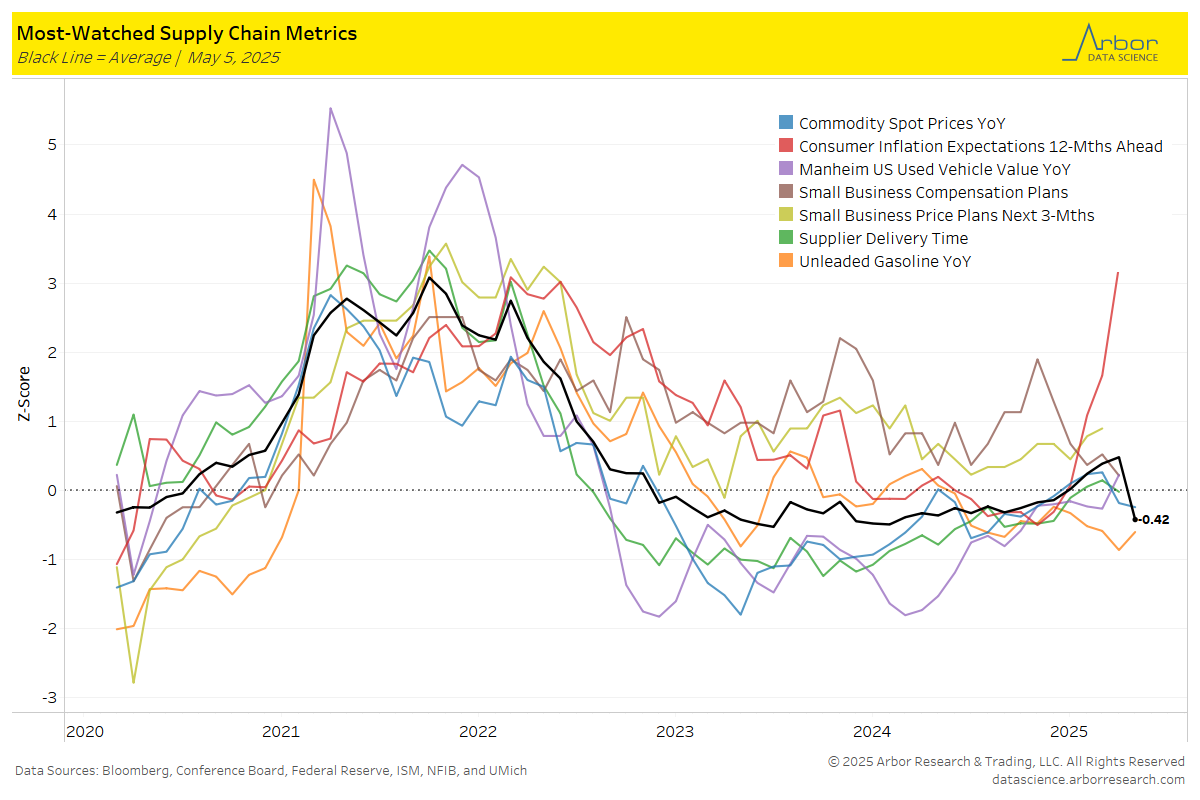
Most-Watched Supply Chain Metrics
- The chart below is a breakdown of supply chain metrics for April 2025.
- The aggregate index of most-watched supply chain metrics (the black line in the chart below) was -0.42, with zero meaning the supply chain is acting normally.
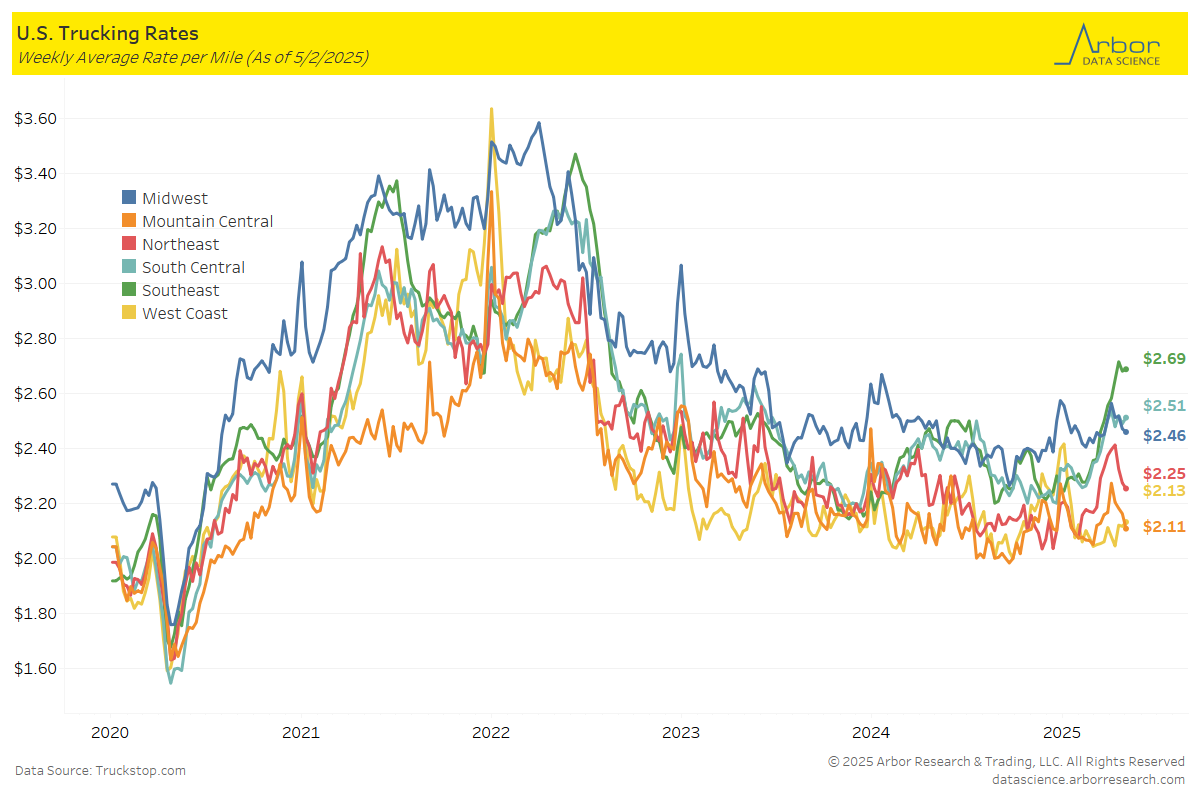
U.S. Trucking Rates
- Trucking rates remained the same week-over-week, with Internet Truckstop’s average equipment rate at $2.51 per mile.
- Trucking rates on a geographical basis were mixed last week. The largest decrease was in Mountain Central which decreased $0.05 to $2.11 per mile. The largest increase was in South Central and West Coast which both increase $0.02 to $2.51 and $2.13, respectively.
Tables