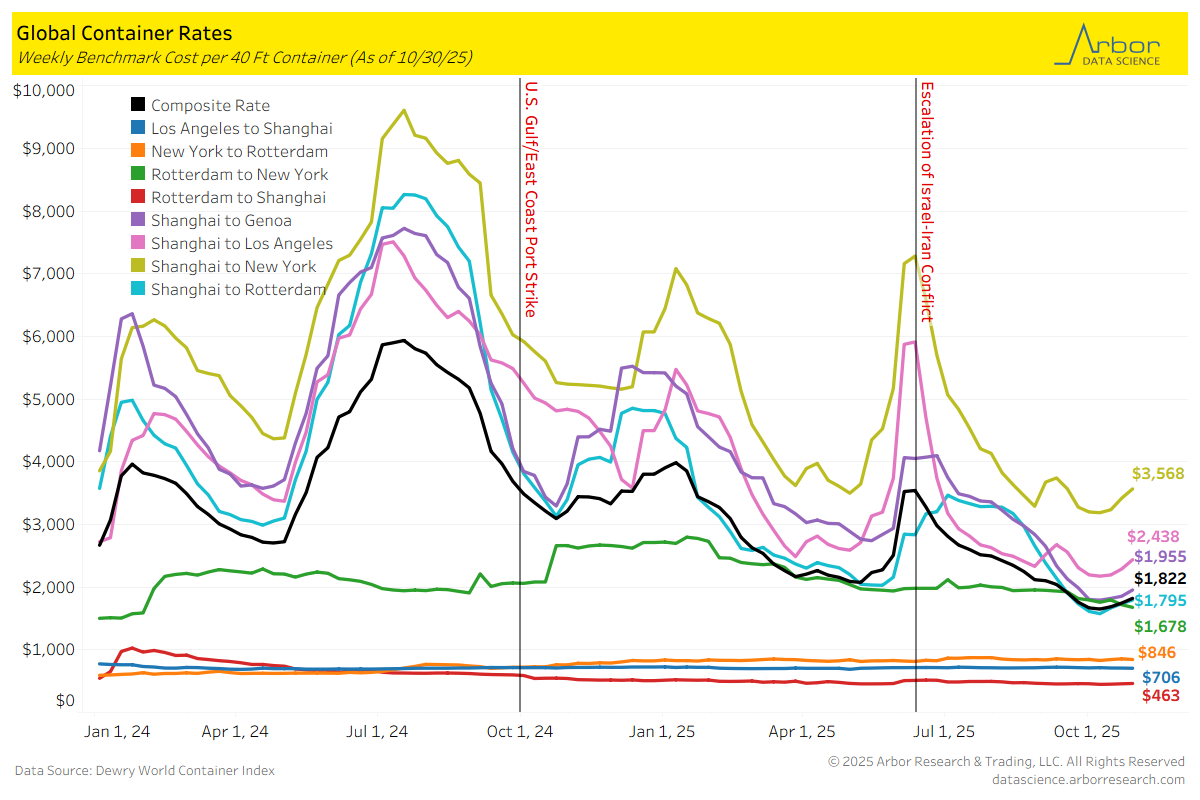
Global Container Rates
- The composite rate per 40-foot container was $1,822 on 10/30/2025, which is up $195 from 10/16/2025. Global container rates were mixed over the past two weeks. The largest increase was from Shanghai to New York which increased $332 to $3,568. The second-largest increase was from Shanghai to Los Angeles, which increased $243 to $2,438.
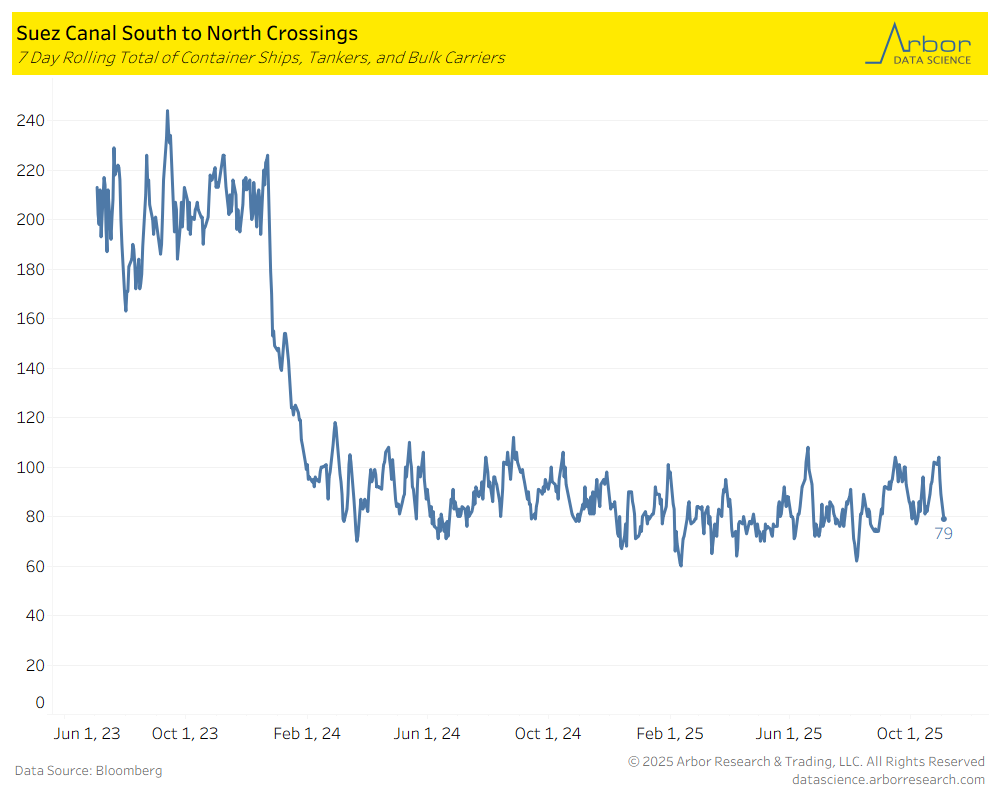
Suez Canal Crossings
- The chart below outlines the 7-day rolling total of container ships, tankers, and bulk carriers traveling South to North through the Suez Canal.
- The total number of crossings on 11/3/2025 was 79 (compared to 85 on 11/4/2024 and 215 on 11/3/2023).
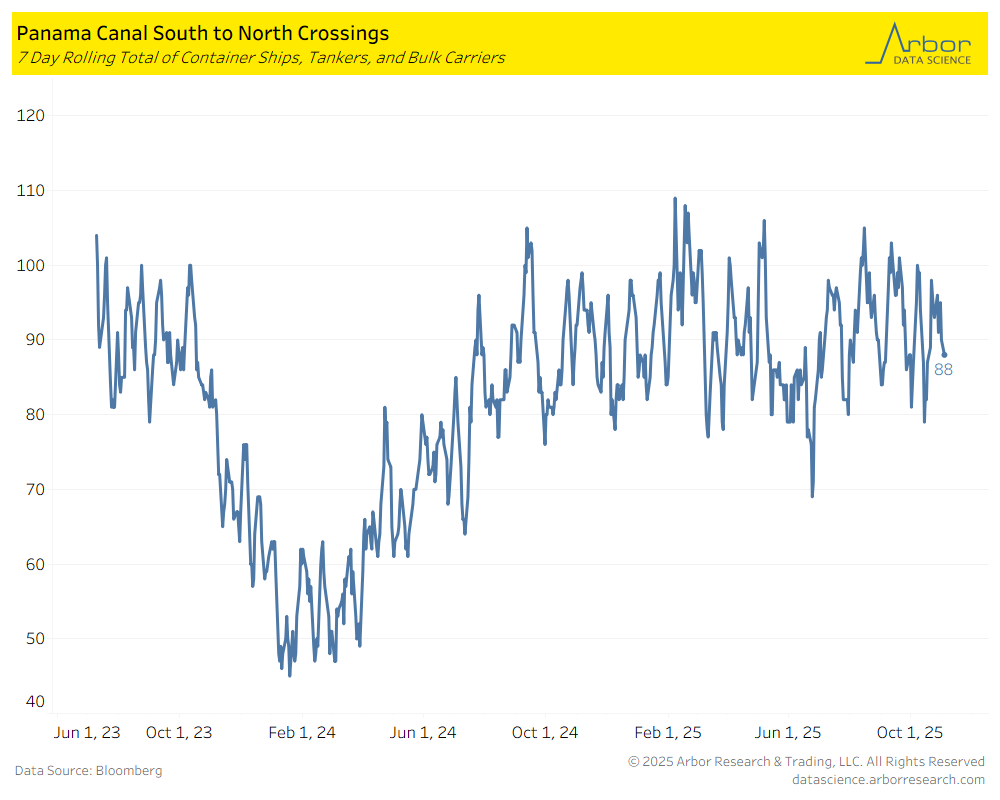
Panama Canal Crossings
- The chart below outlines the 7-day rolling total of container ships, tankers, and bulk carriers traveling South to North through the Panama Canal.
- The total number of crossings on 11/3/2025 was 88 (compared to 97 on 11/4/2024).
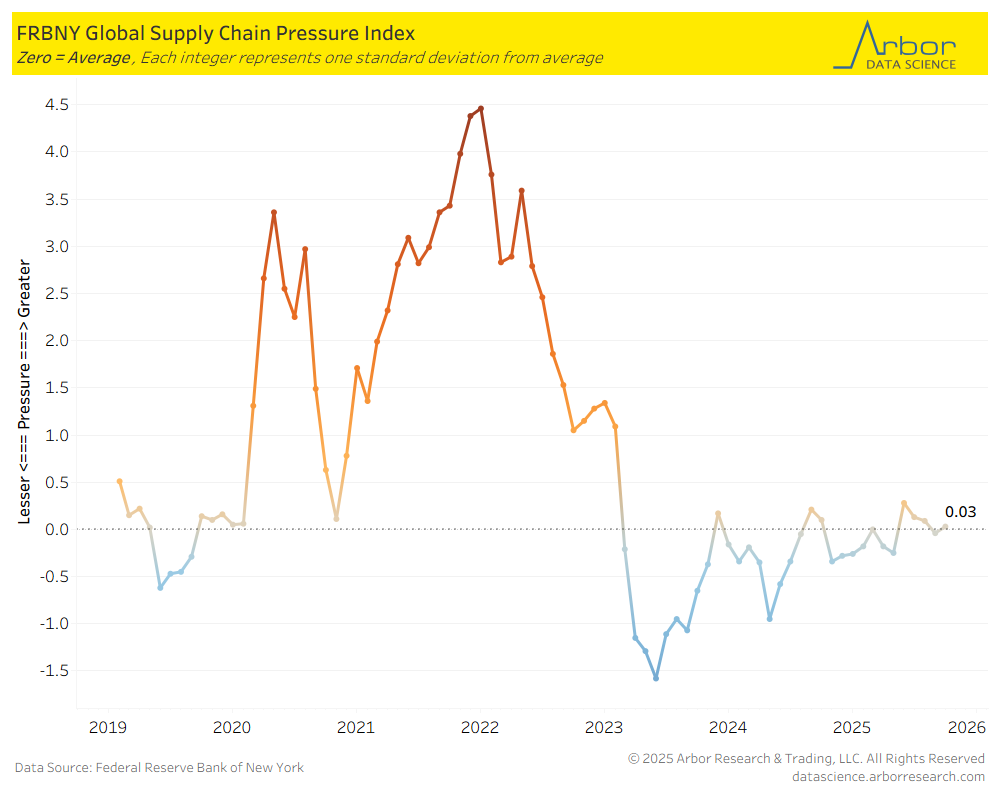
Global Supply Chain Pressure Index
- The Federal Reserve Bank of New York’s Global Supply Chain Pressure Index (GSCPI) increased from -0.08 in August 2025 to 0.03 in September 2025.
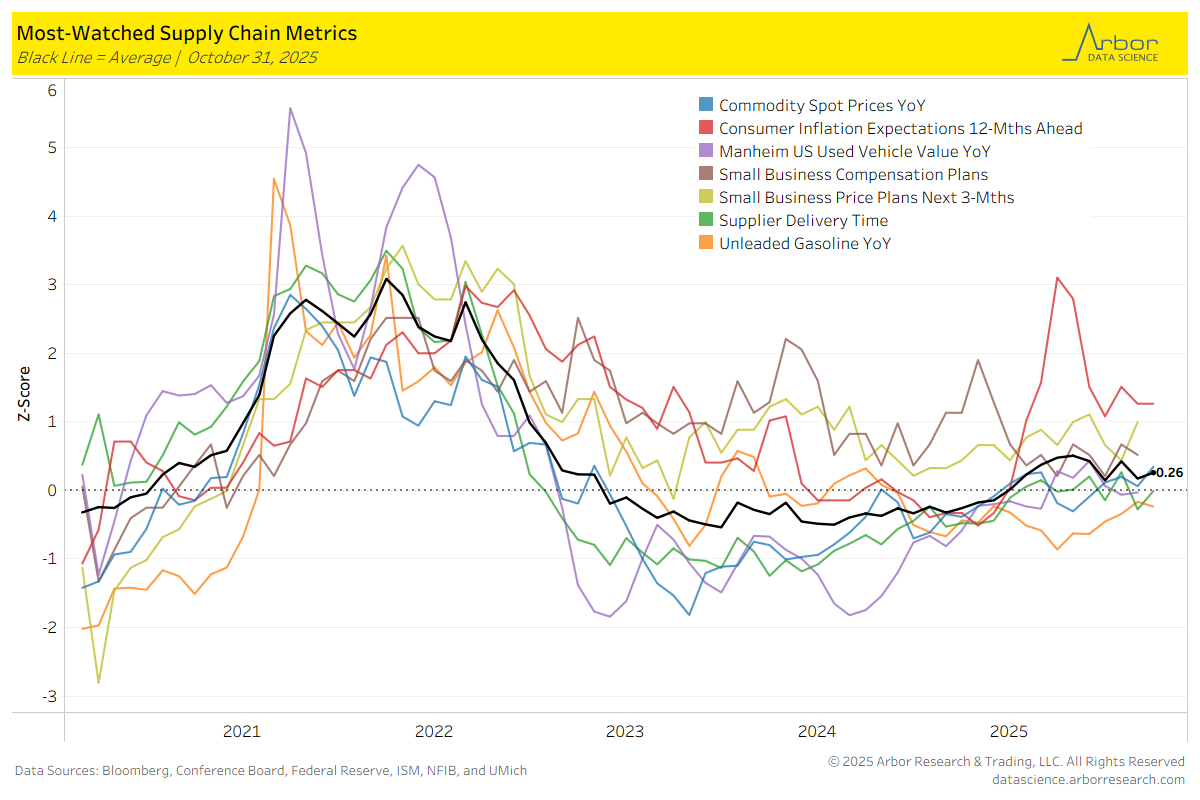
Most-Watched Supply Chain Metrics
- The chart below is a breakdown of supply chain metrics for October 2025.
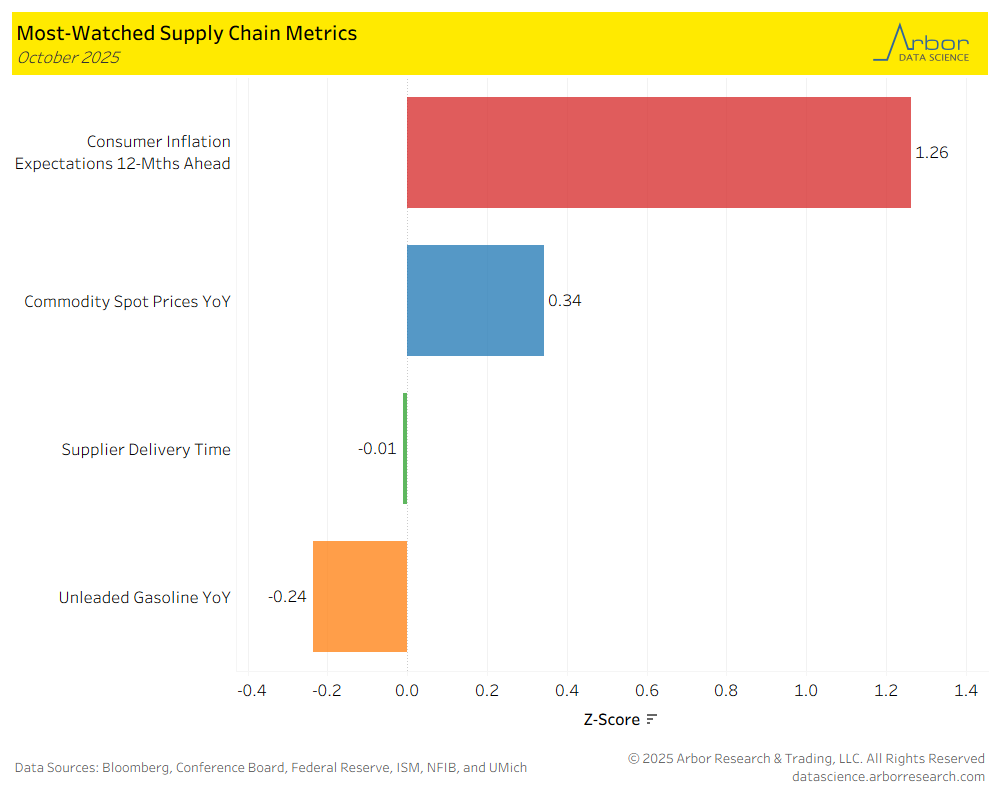
- The aggregate index of most-watched supply chain metrics (the black line in the chart below) was 0.26, with zero meaning the supply chain is acting normally.
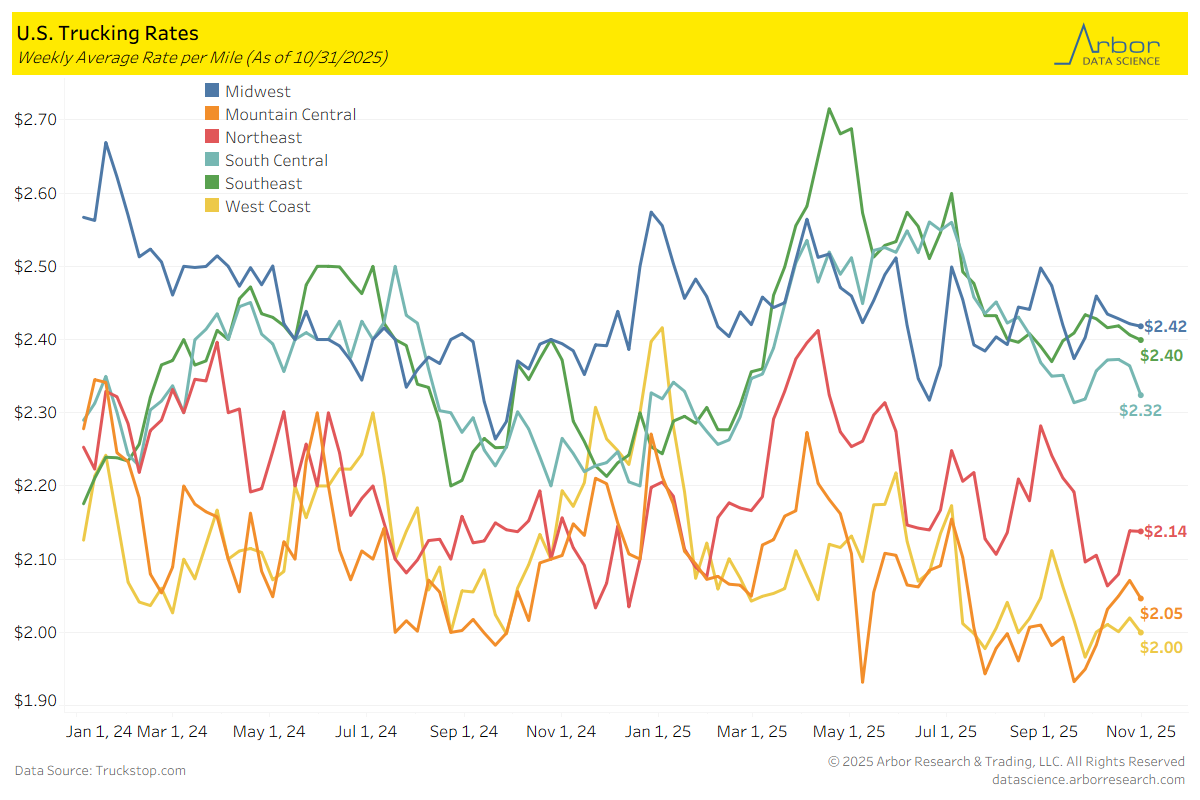
U.S. Trucking Rates
- Trucking rates were mixed week-over-week, with Internet Truckstop’s average equipment rate at $2.28 per mile.
- Trucking rates on a geographical basis were mixed over the past two weeks. The largest increase was in the Northeast region which increased $0.06 to $2.14 per mile. The largest decrease was in the South Central region which decreased $0.05 to $2.32 per mile.

Tables