In Recent News
- The shipping container industry posted a decline in earnings for Q2 2025, a third consecutive quarter with a decline.
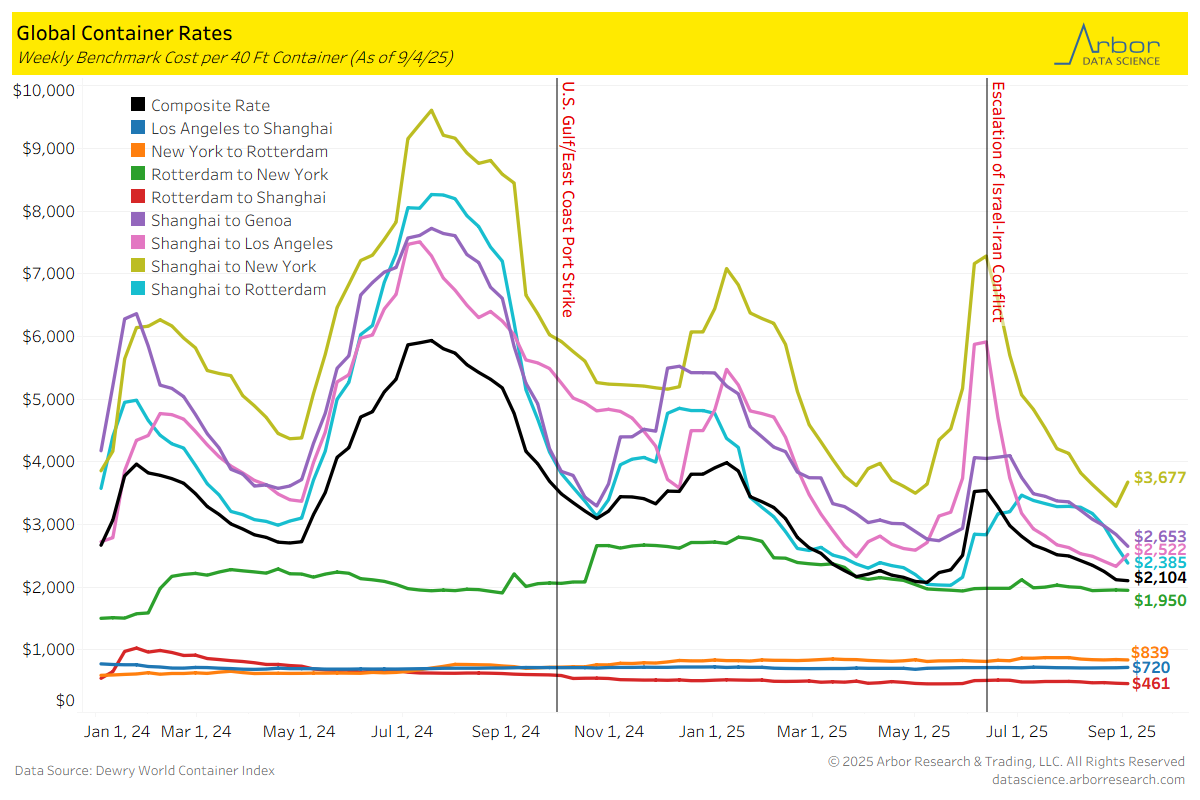
Global Container Rates
- The composite rate per 40-foot container was $2,104 on 9/4/25, which is down $146 from 8/21/2025. Global container rates were mixed over the past two weeks. The largest decrease was from Shanghai to Rotterdam which decreased $588 to $2,385. The largest increase was from Shanghai to New York, which decreased $214 to $3,677.
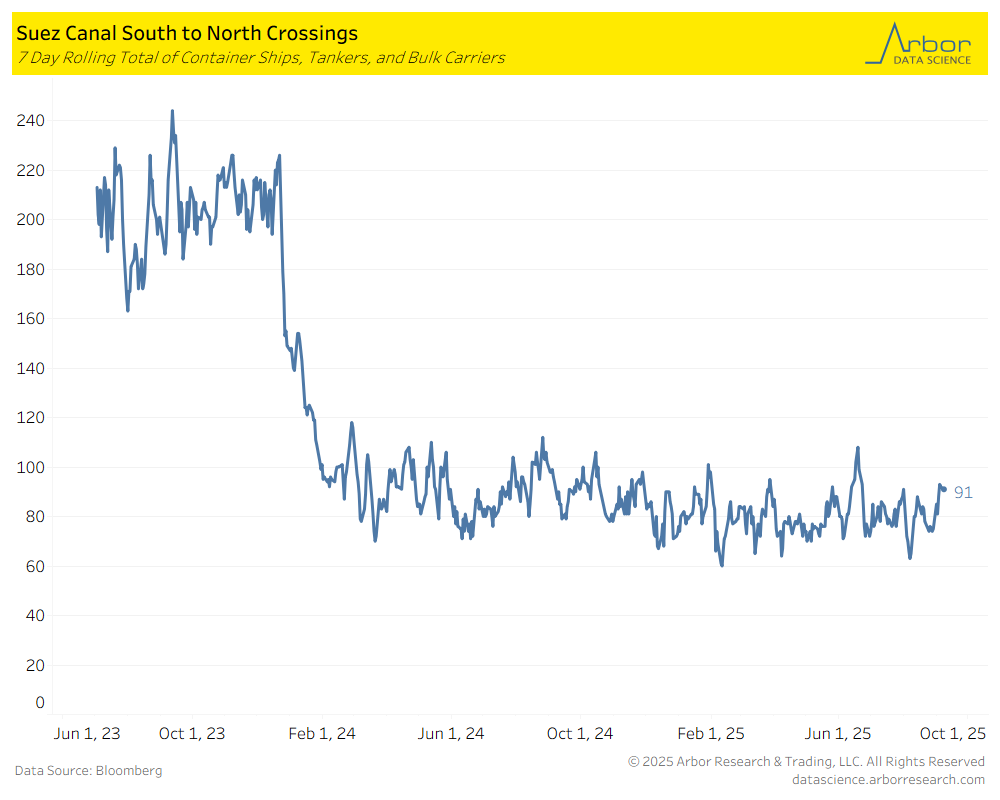
Suez Canal Crossings
- The chart below outlines the 7-day rolling total of container ships, tankers, and bulk carriers traveling South to North through the Suez Canal.
- The total number of crossings on 9/8/25 was 91 (compared to 87 on 9/9/24 and 216 on 9/8/2023).
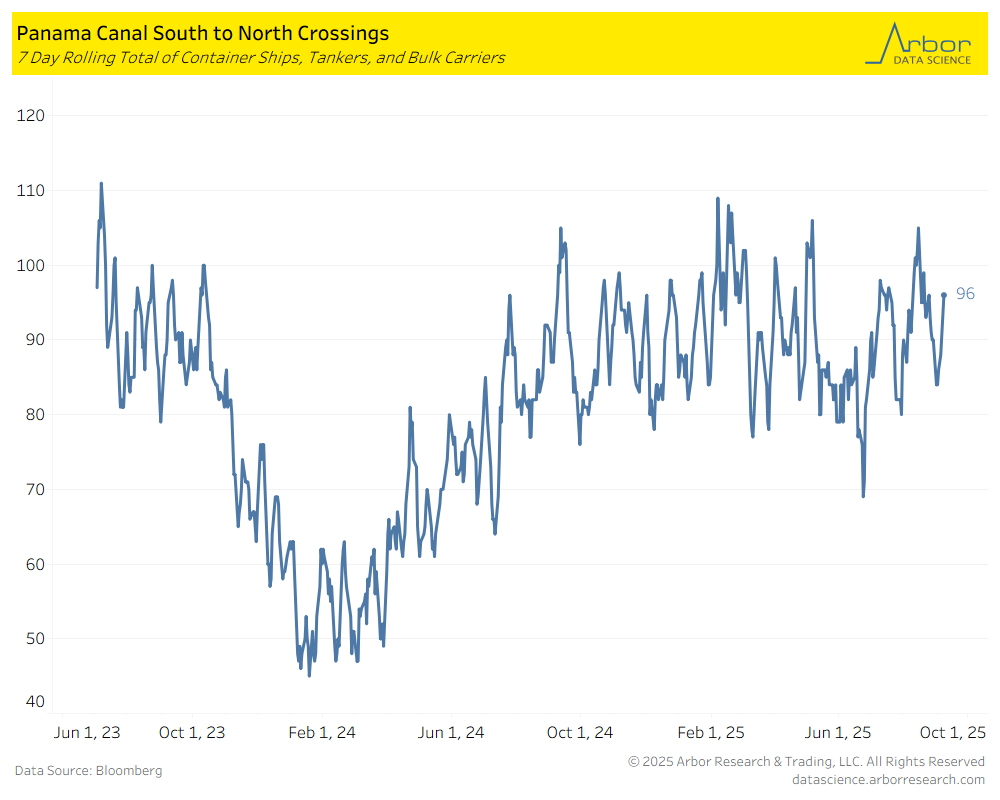
Panama Canal Crossings
- The chart below outlines the 7-day rolling total of container ships, tankers, and bulk carriers traveling South to North through the Panama Canal.
- The total number of crossings on 9/8/25 was 96 (compared to 96 on 9/9/24).
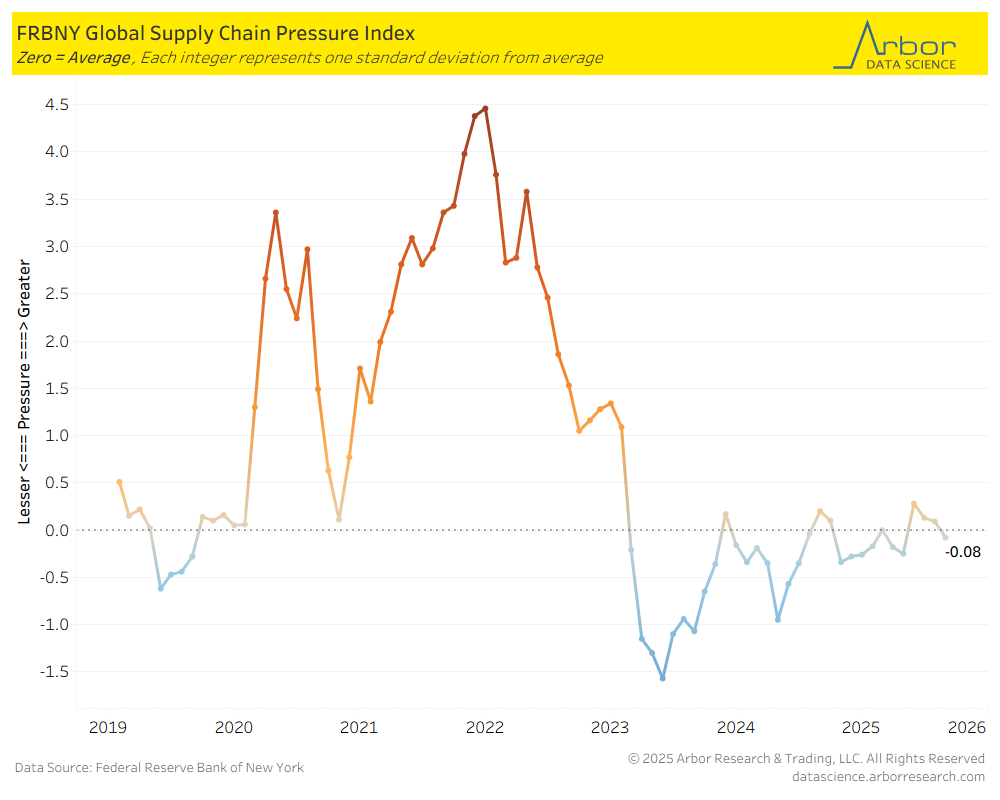
Global Supply Chain Pressure Index
- The Federal Reserve Bank of New York’s Global Supply Chain Pressure Index (GSCPI) decreased from 0.07 in July 2025 to -0.08 in August 2025.
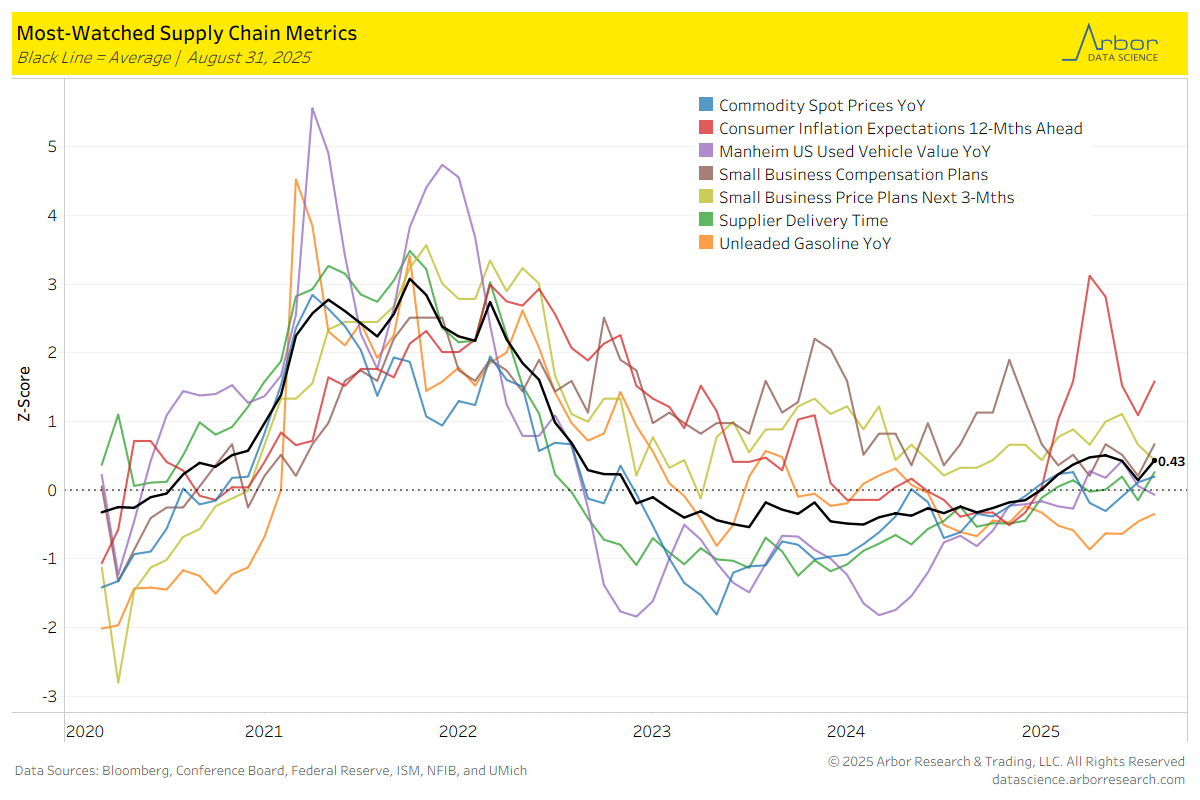
Most-Watched Supply Chain Metrics
- The chart below is a breakdown of supply chain metrics for August 2025.
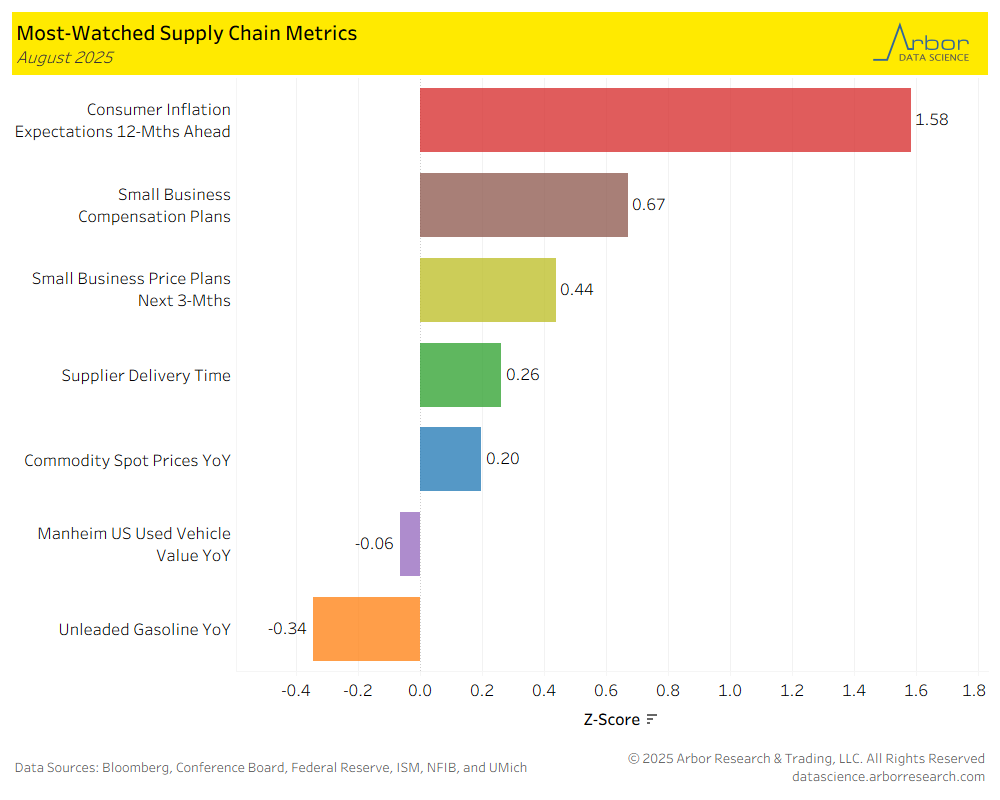
- The aggregate index of most-watched supply chain metrics (the black line in the chart below) was 0.43, with zero meaning the supply chain is acting normally.
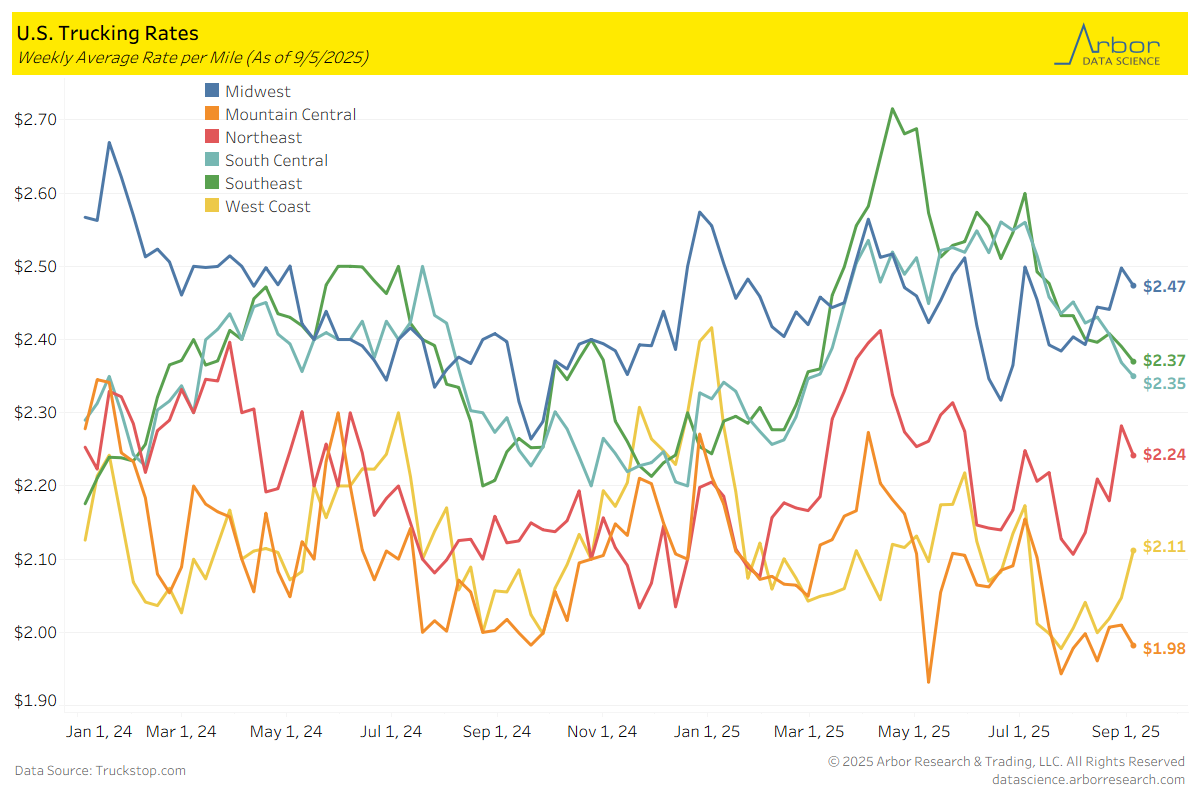
U.S. Trucking Rates
- Trucking rates were mixed week-over-week, with Internet Truckstop’s average equipment rate at $2.31 per mile.
- Trucking rates on a geographical basis were mixed over the past two weeks. The largest increase was in the West Coast region which increased $0.09 to $2.11 per mile. The largest decrease was in the South Central region which decreased $0.06 to $2.35 per mile.

Tables