The Rhine River is Dangerously Low
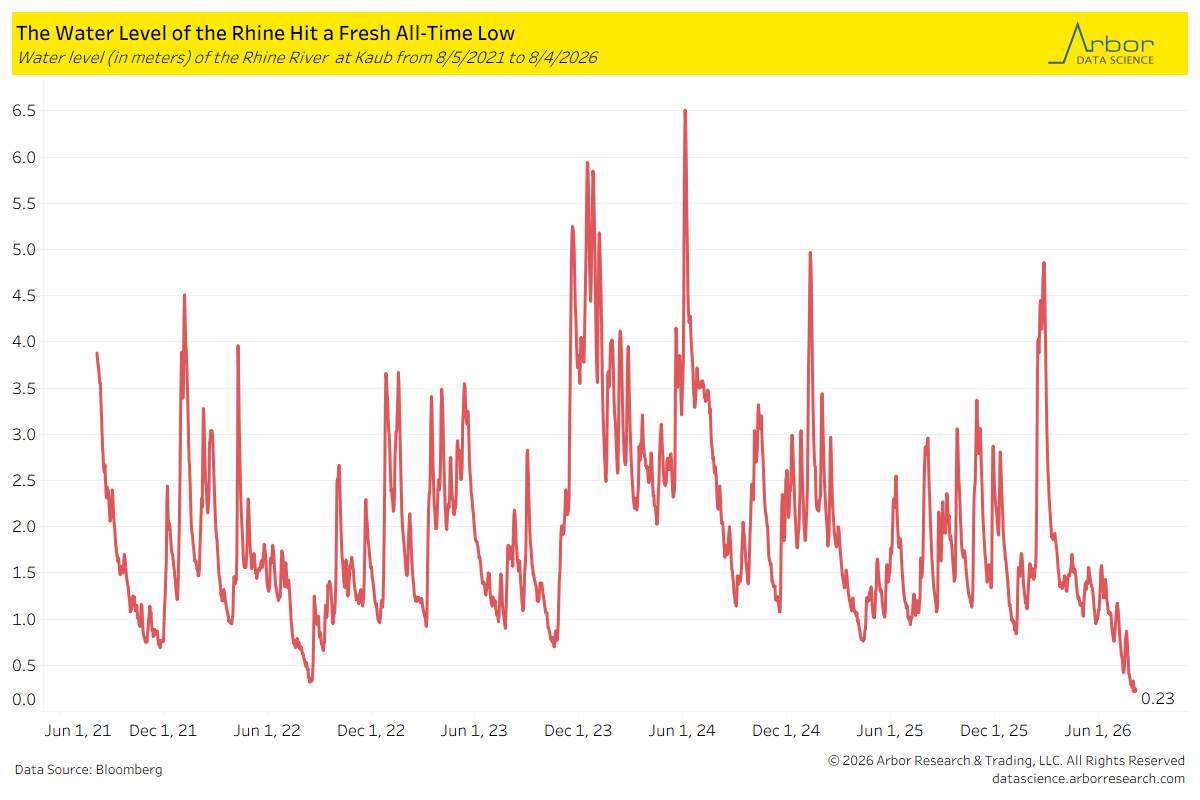
- The level of the Rhine River at Kaub, a chokepoint for ships heading from the ports in the Netherlands to southern Germany, was at 0.23 meters on 8/3/2026. This was an all-time low for the river, yet current forecasts expect it to fall to 0.17 meters on 8/8/2026.
- A lower water level forces vessels to restrict the total load they carry, which will likely increase the cost for shipping down the waterway.
Global Container Rates
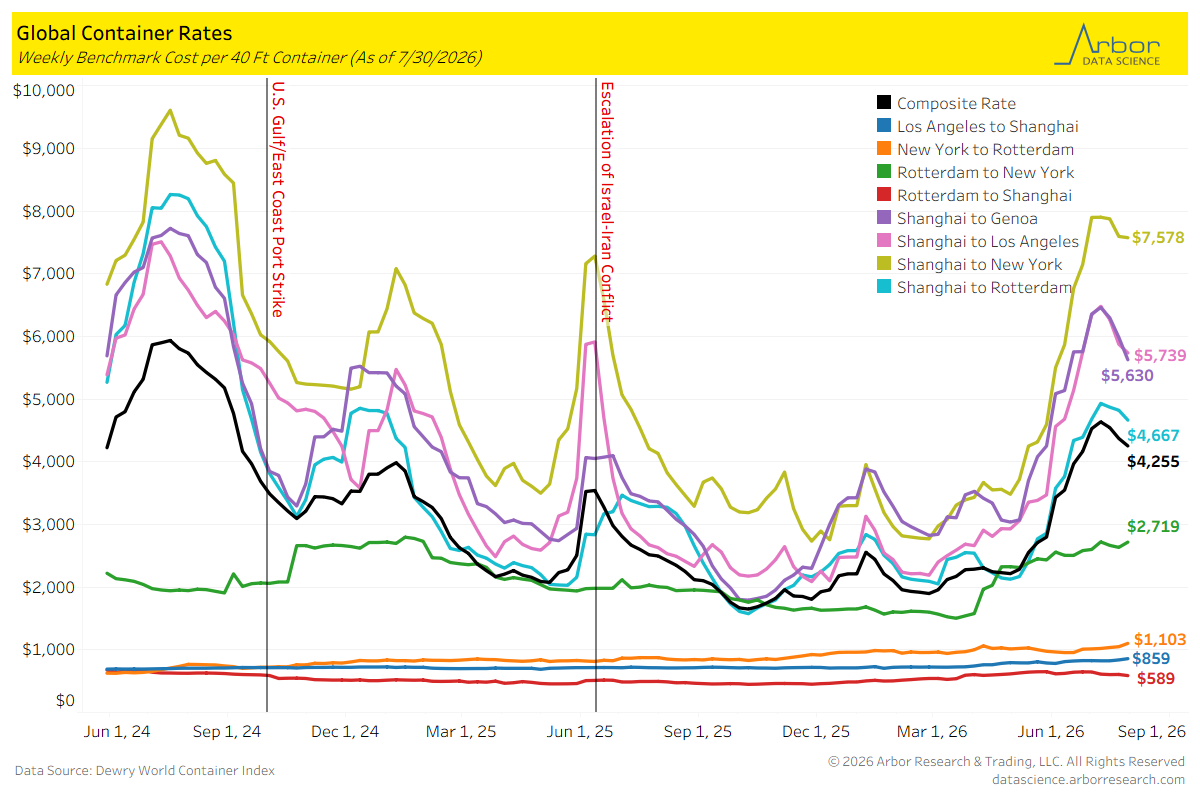
- The composite rate per 40-foot container was $4,255 on 7/30/2026, which is down $119 from 7/23/2026.
- Global container rates decreased were mixed from 7/23/2026 to 7/30/2026. The largest increase was from Rotterdam to New York, which increased $44 to $2,719. Shanghai to Genoa had the largest decrease, falling $358 to $5,630.
Strait of Hormuz Crossings
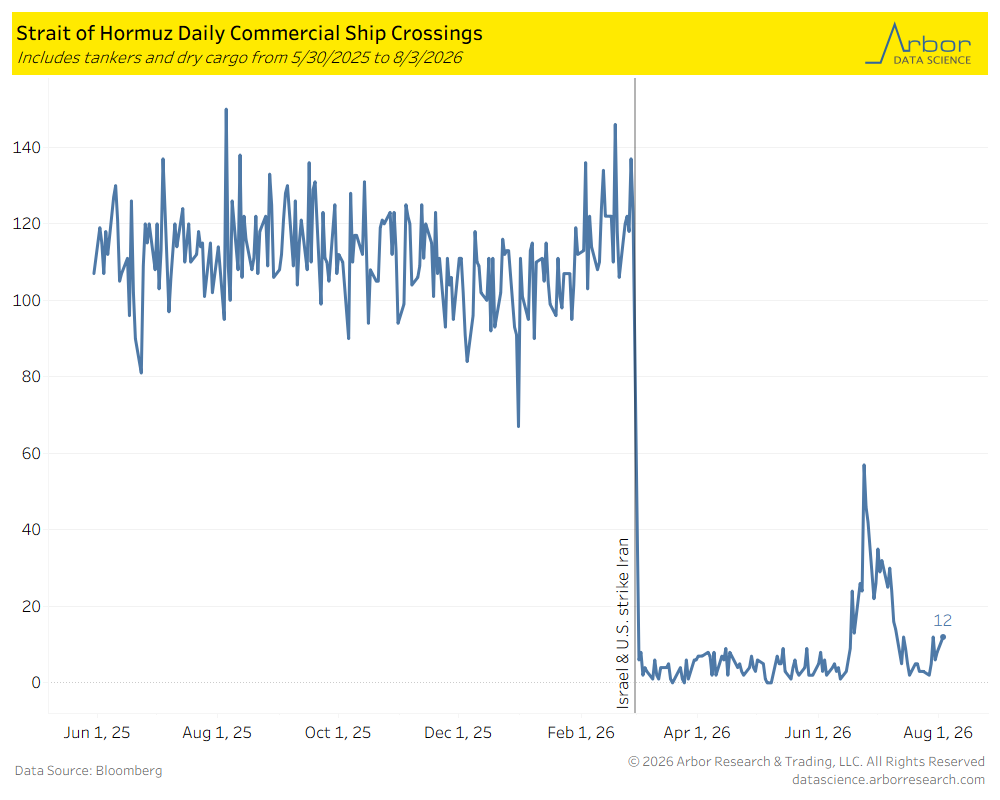
- According to Bloomberg Analysis of automatic identification systems (AIS), there were 12 tankers and dry cargo ships that crossed through the Strait of Hormuz on 8/3/2026.
Suez Canal Crossings
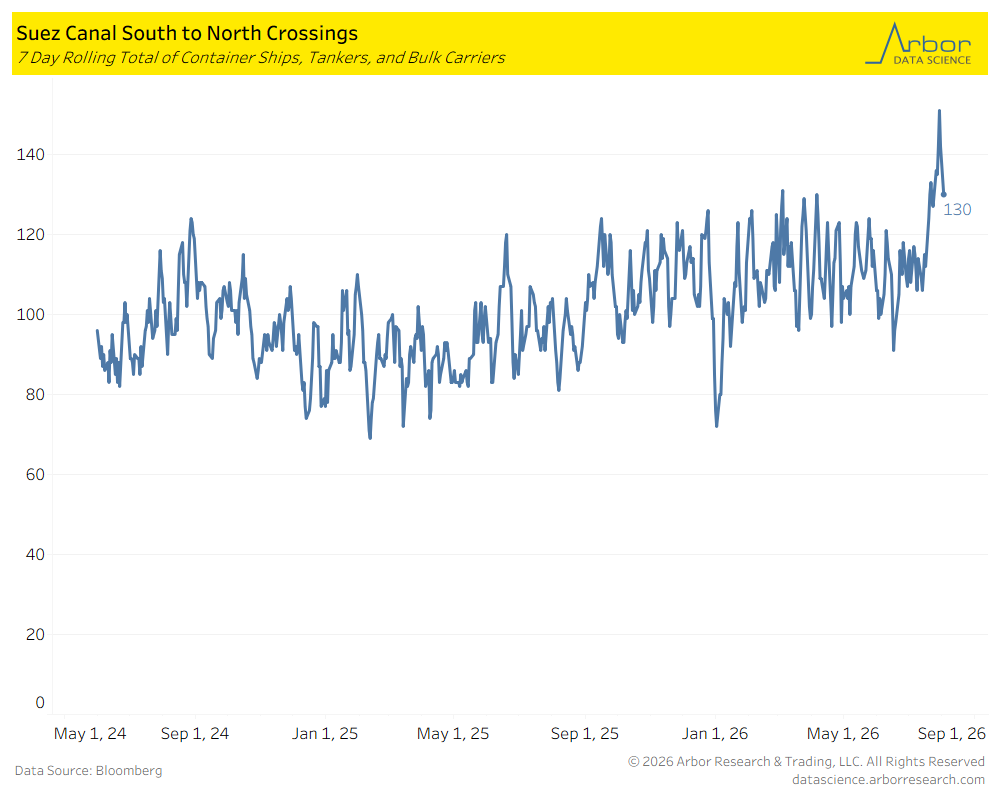
- The chart below outlines the 7-day rolling total of container ships, tankers, and bulk carriers traveling South to North through the Suez Canal.
- On 8/3/2026, the 7-day rolling total was 130.
Panama Canal Crossings
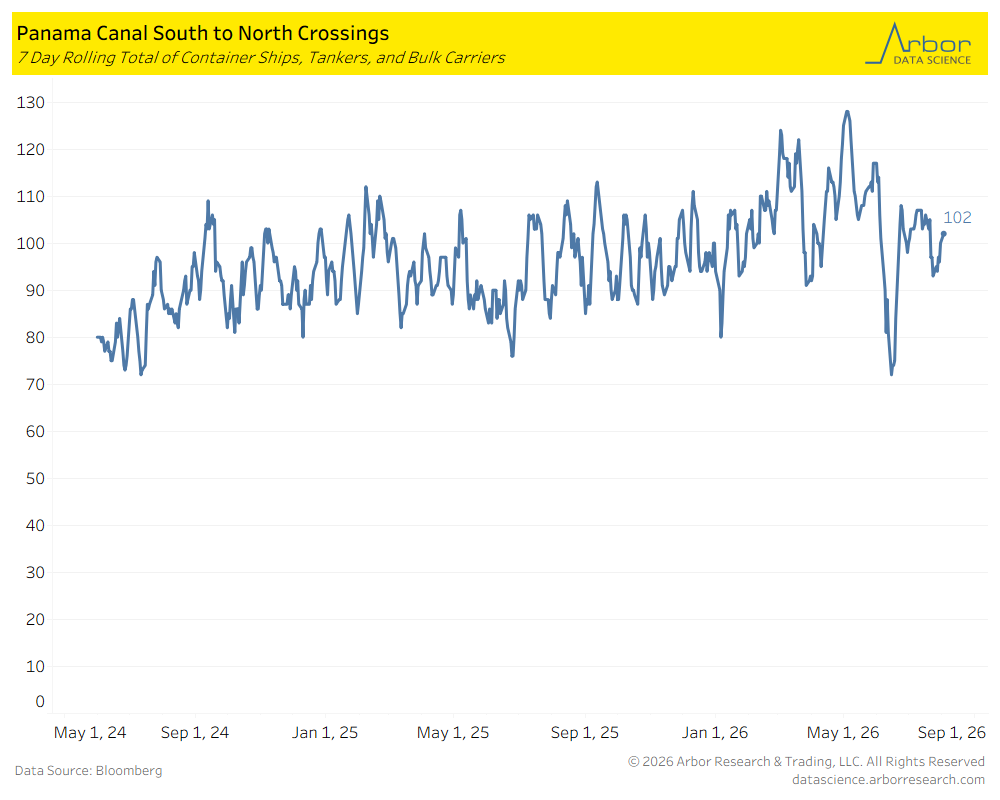
- The chart below outlines the 7-day rolling total of container ships, tankers, and bulk carriers traveling South to North through the Panama Canal.
- On 8/3/2026, the 7-day rolling total was 102.
U.S. Trucking Rates
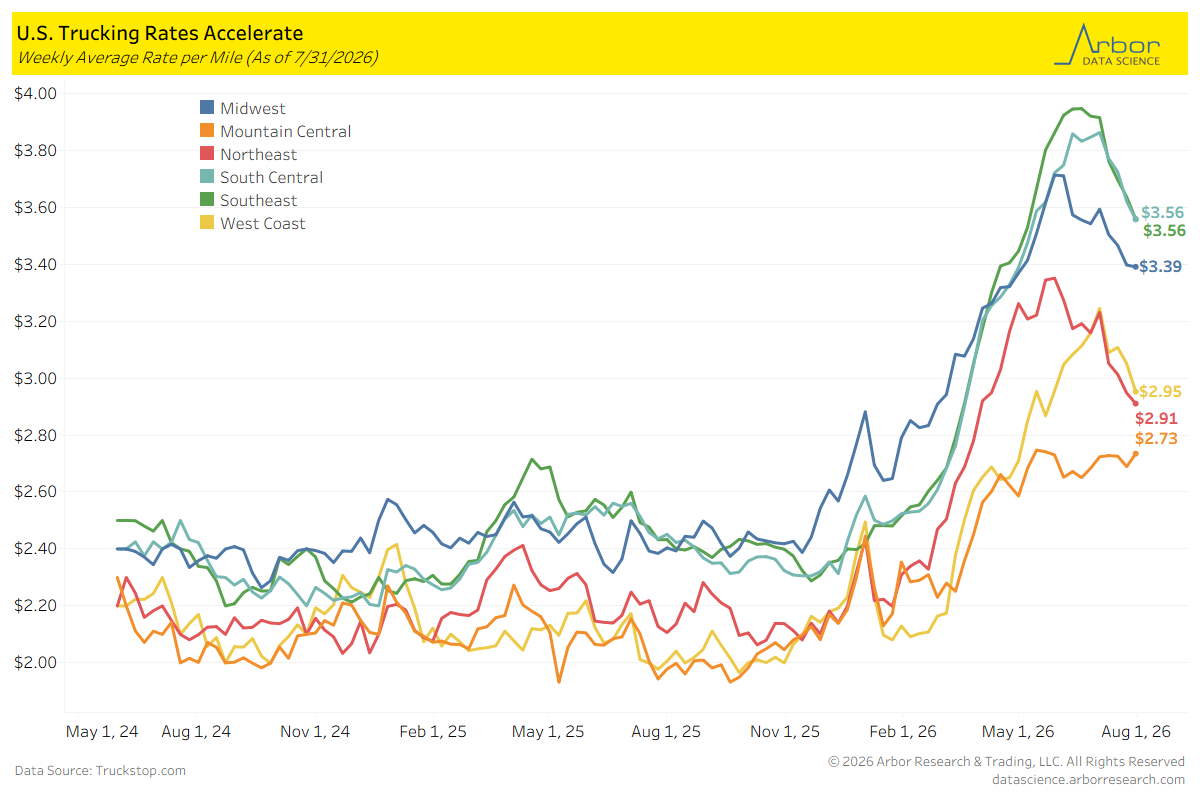
- The Internet Truckstop’s Average Equipment rate was $3.32 per mile as of 7/31/2026.
- Trucking rates decreased for all but one region over the past week. The rate for the West Coast region had the largest decrease, falling $0.10 per mile. The rate increased in the Mountain Central region by $0.05 per mile.
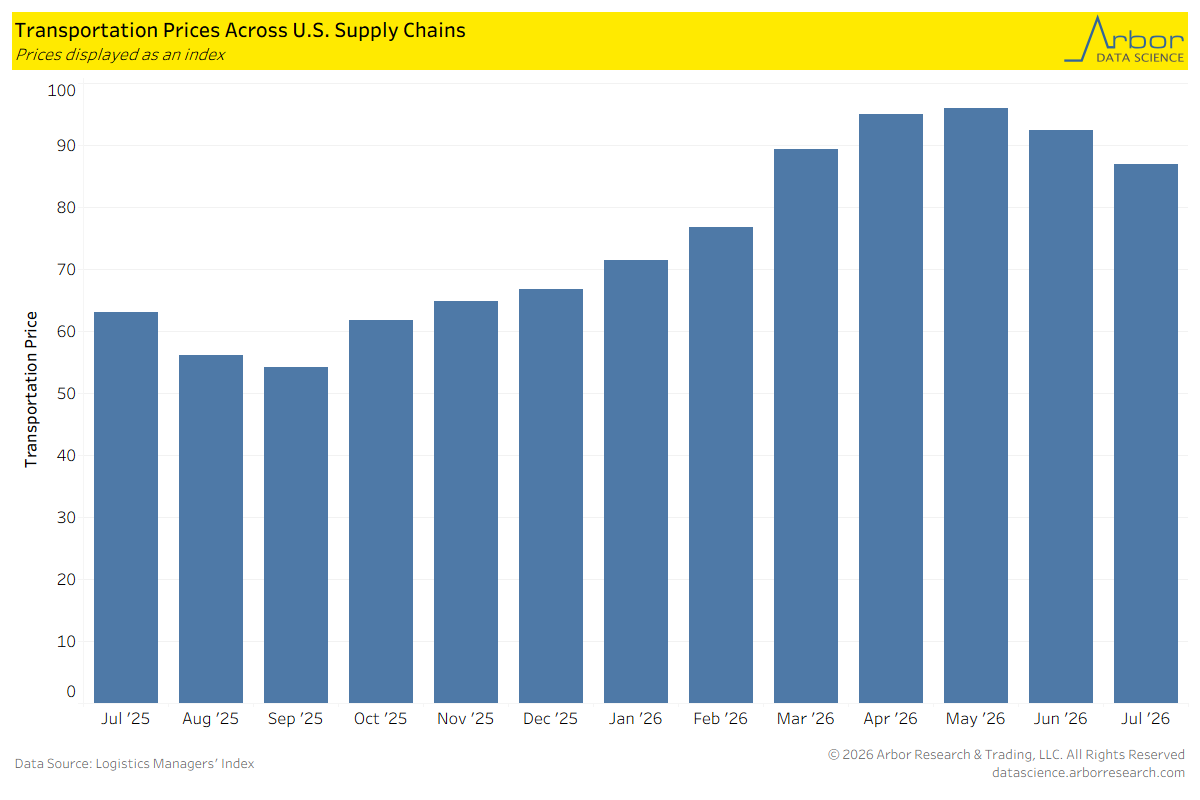
Transportation Price for U.S. Supply Chains Continued to Fall in July
- The transportation price index, tracked by the Logistics Managers’ Index, fell to 86.9 in July 2026 — marking the the second consecutive month of decreases.
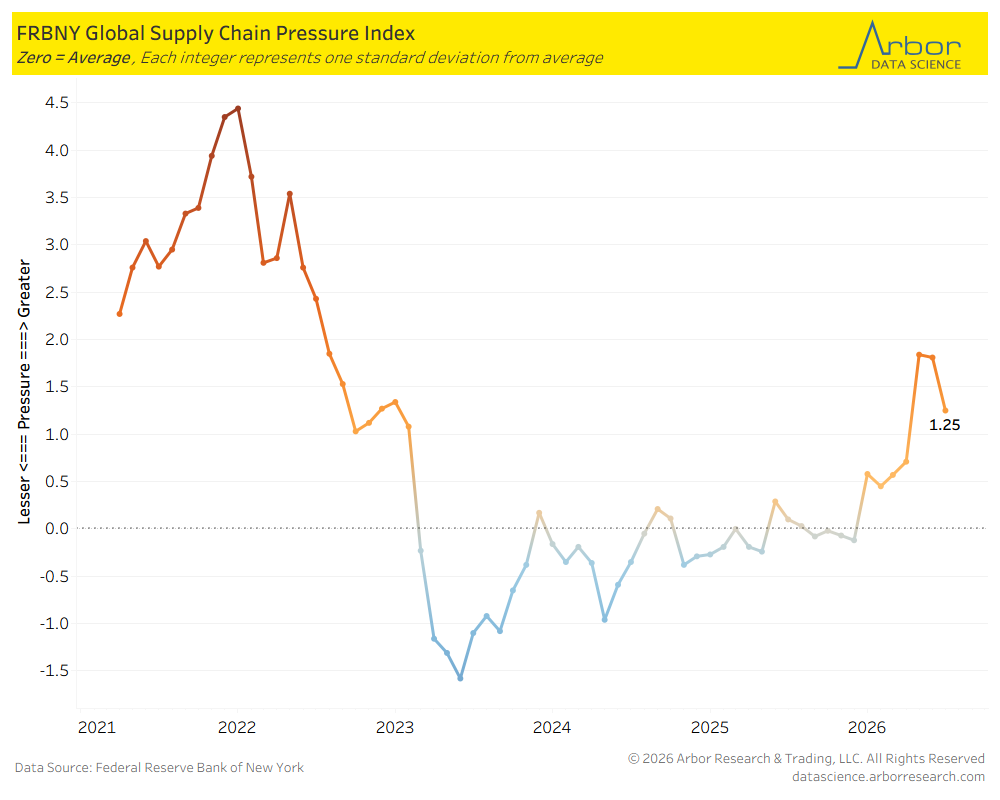
Global Supply Chain Pressure Index
- The Federal Reserve Bank of New York’s Global Supply Chain Pressure Index (GSCPI) decreased from 1.77 in May 2026 to 1.25 in June 2026.
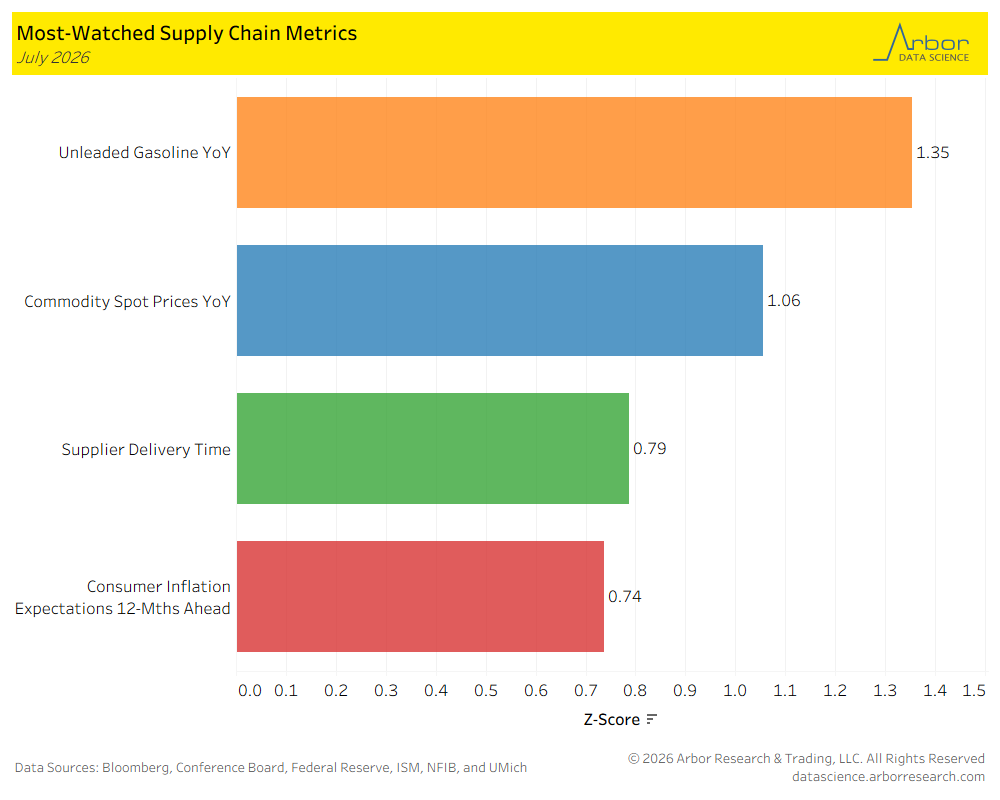
Most-Watched Supply Chain Metrics
- The chart below is a breakdown of supply chain metrics for July 2026.
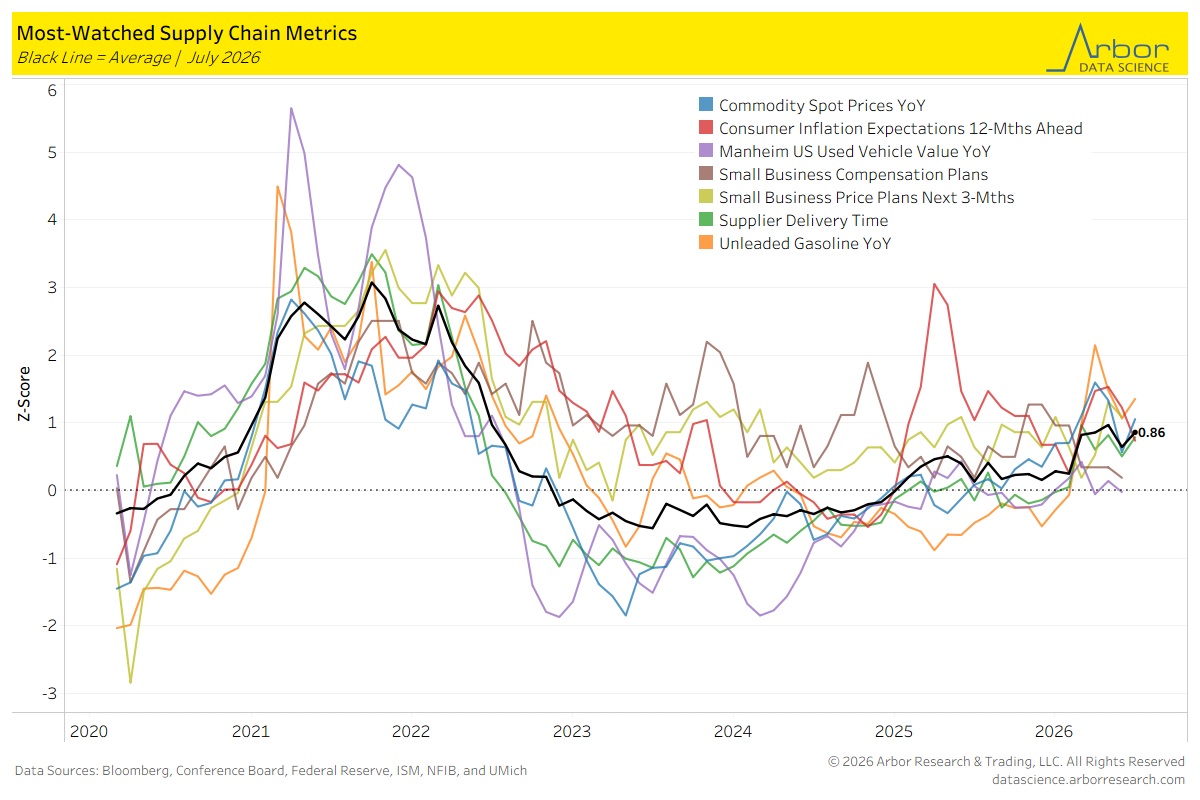
- The aggregate index of most-watched supply chain metrics (the black line in the chart below) was 0.86, with zero meaning the supply chain is acting normally.
Tables