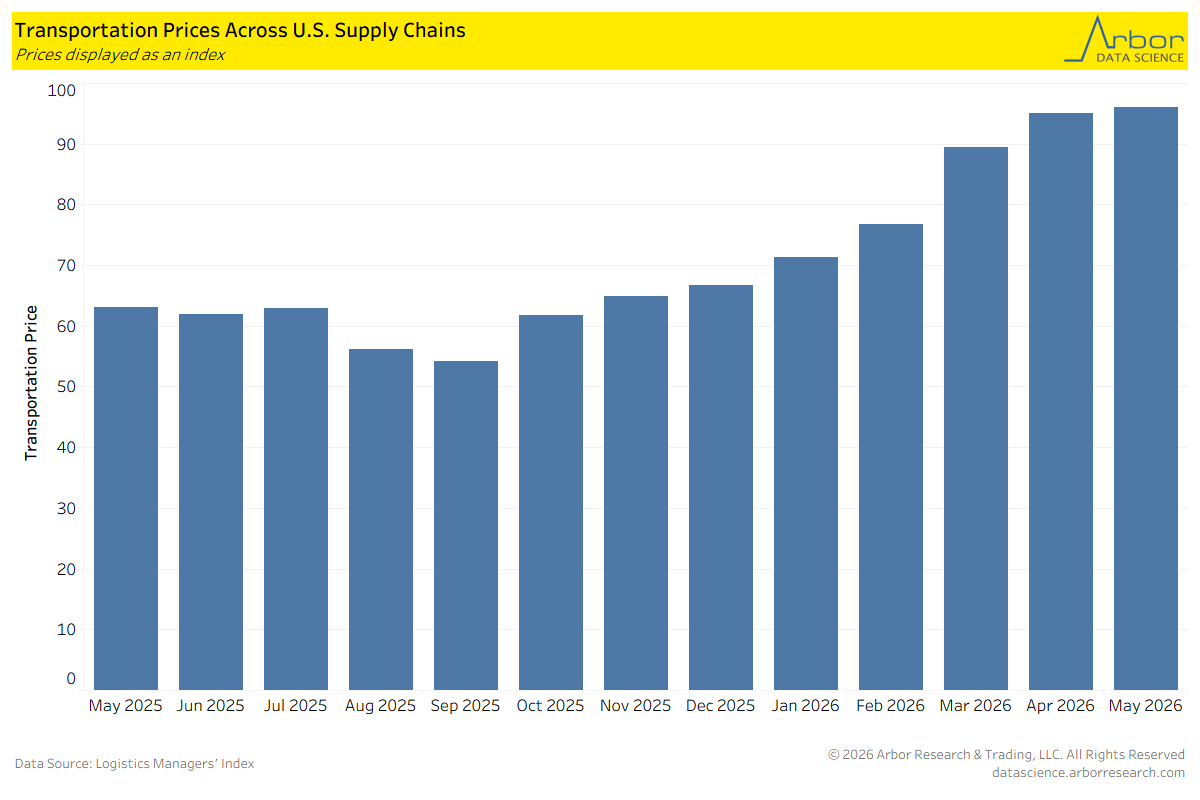
Transportation Price for U.S. Supply Chain’s Reached an All-Time High in May
- The transportation price index, tracked by the Logistics Managers’ Index, hit an all-time high of 96 in May 2026.
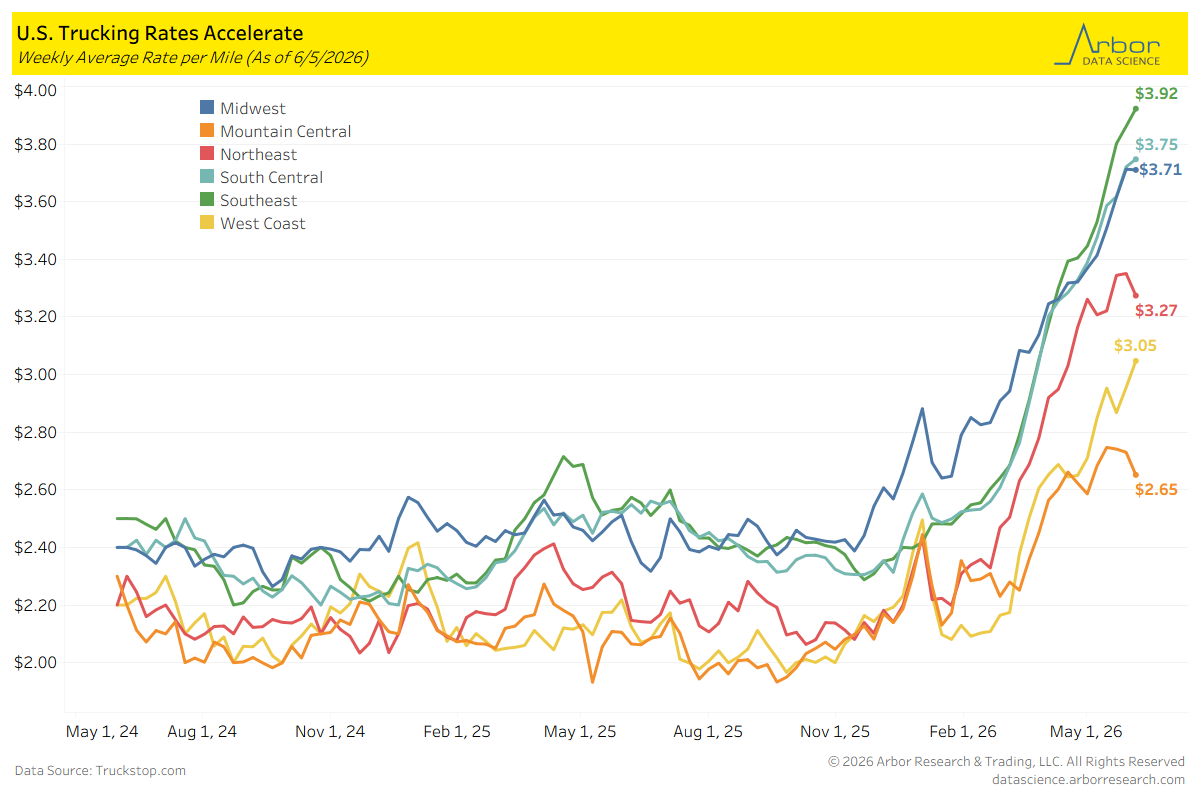
U.S. Trucking Rates
- The Internet Trucks Spot Average Equipment rate was $3.67 per mile as of 6/5/2026.
- Trucking rates increased for five of the six geographical regions over the past week. The rate for the West Coast region had the largest increase, at $0.09 per mile. The Mountain Central and Northeast regions both fell $0.08.
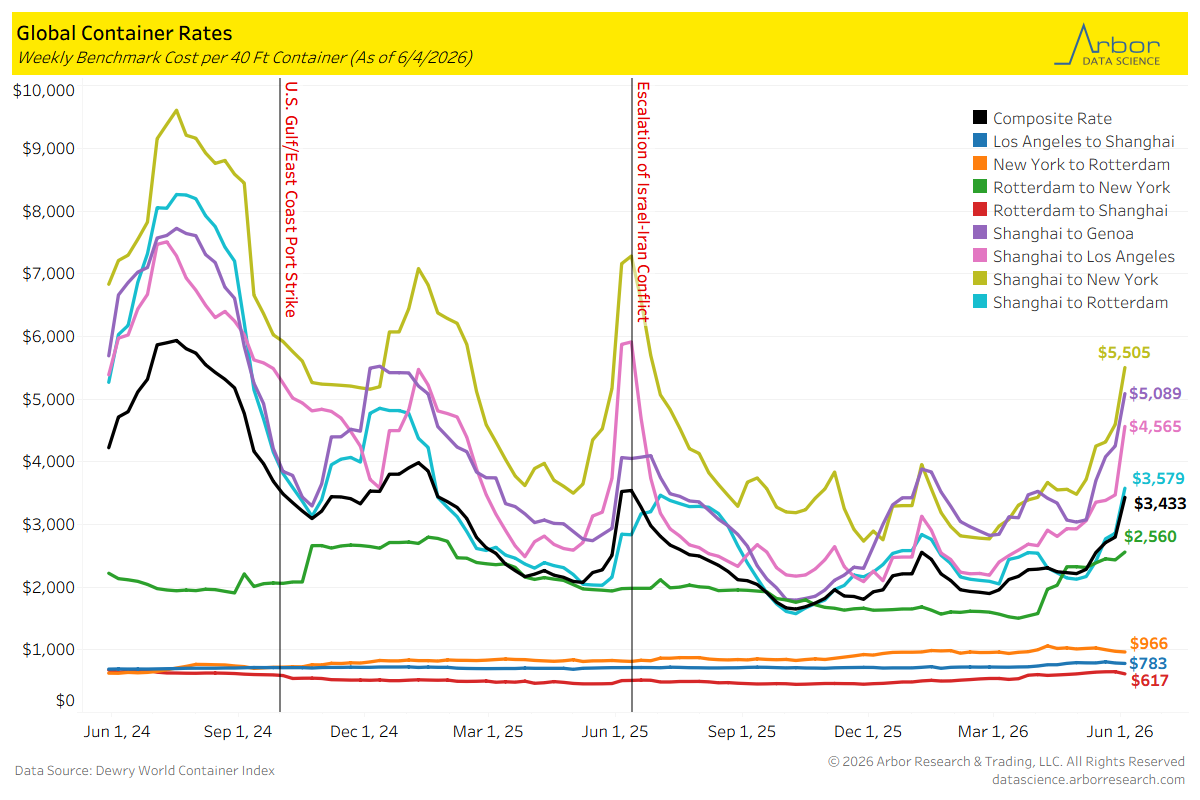
Global Container Rates
- The composite rate per 40-foot container was $3,433 on 6/4/2026, which is up $633 from 5/28/2026.
- Global container rates were mixed from 5/21/2026 to 5/28/2026. The largest increase was from Shanghai to Los Angeles, which increased $1,092 to $4,565. The largest decrease was from Rotterdam to Shanghai, which decreased $34 to $617.
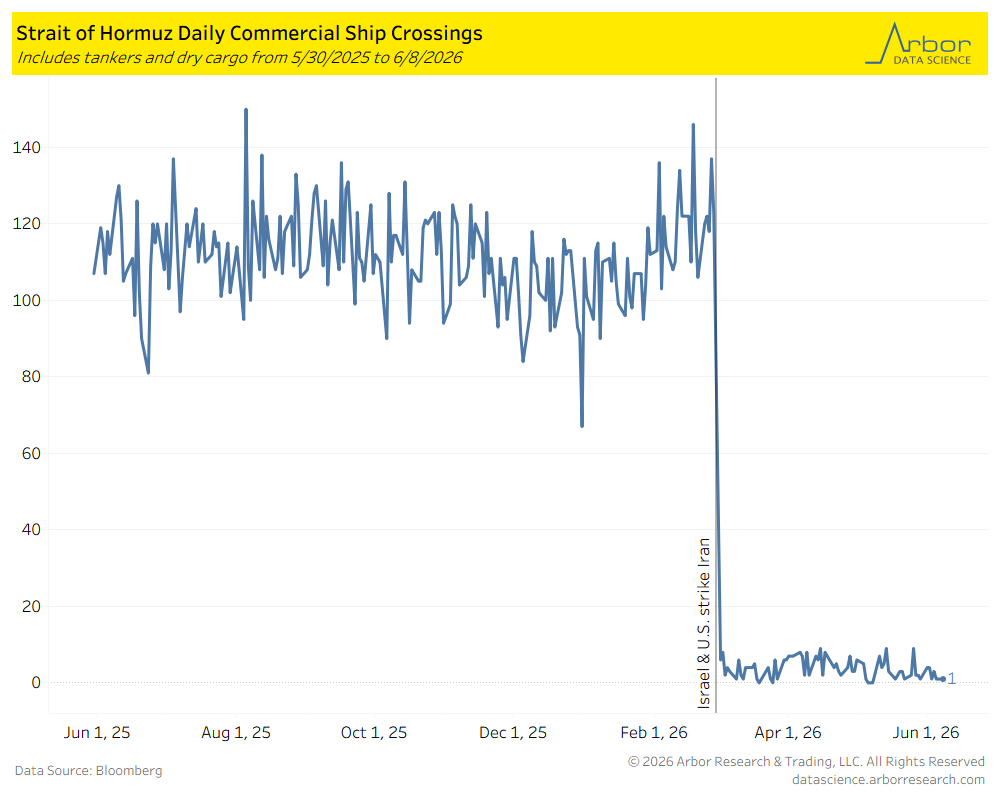
Strait of Hormuz Crossings
- According to Bloomberg Analysis of automatic identification systems (AIS), there was 1 dry cargo ship that crossed through the Strait of Hormuz on 6/8/2026.
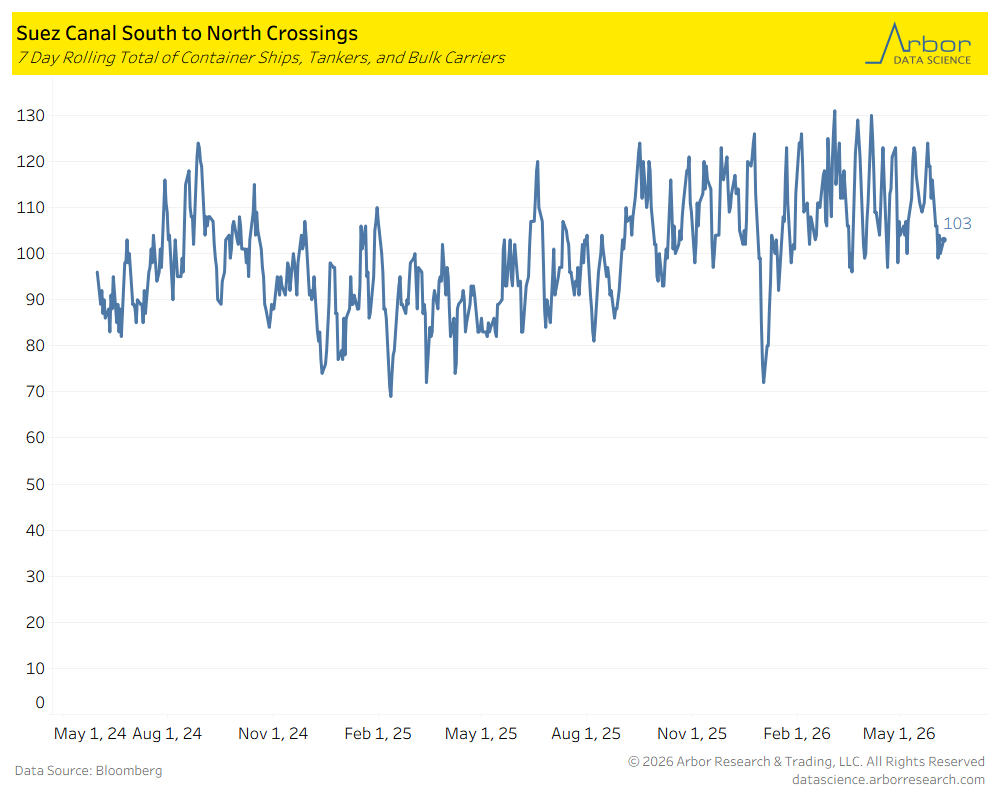
Suez Canal Crossings
- The chart below outlines the 7-day rolling total of container ships, tankers, and bulk carriers traveling South to North through the Suez Canal.
- On 6/8/2026, the 7-day rolling total was 103.
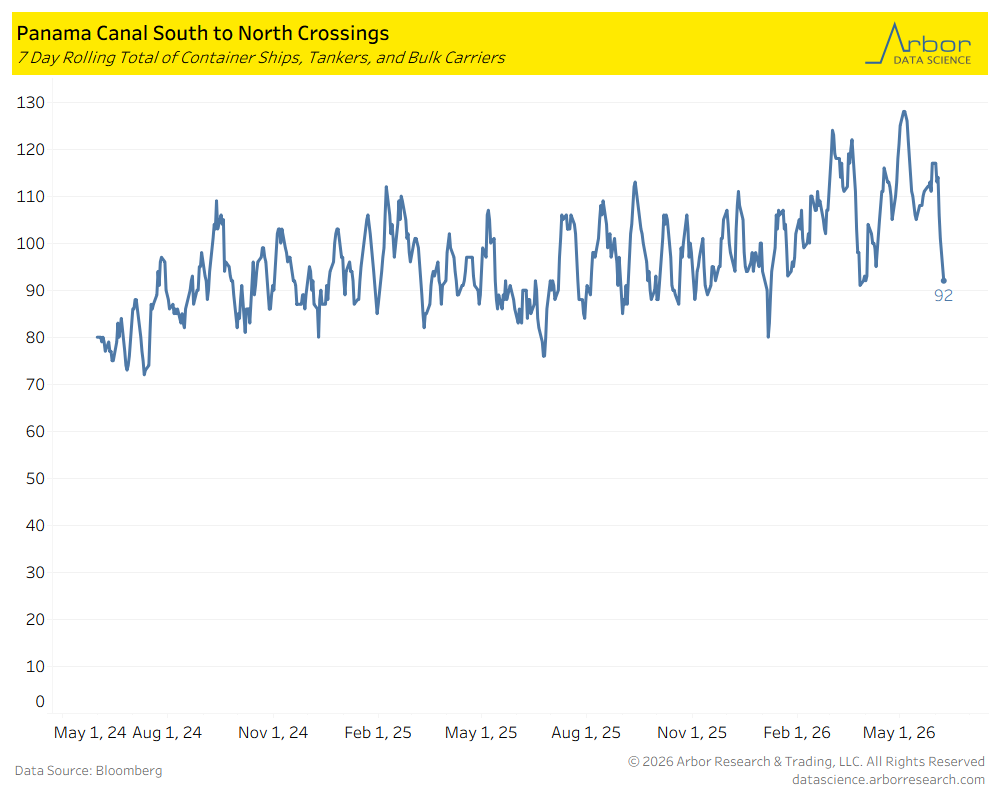
Panama Canal Crossings
- The chart below outlines the 7-day rolling total of container ships, tankers, and bulk carriers traveling South to North through the Panama Canal.
- On 6/8/2026, the 7-day rolling total was 92.
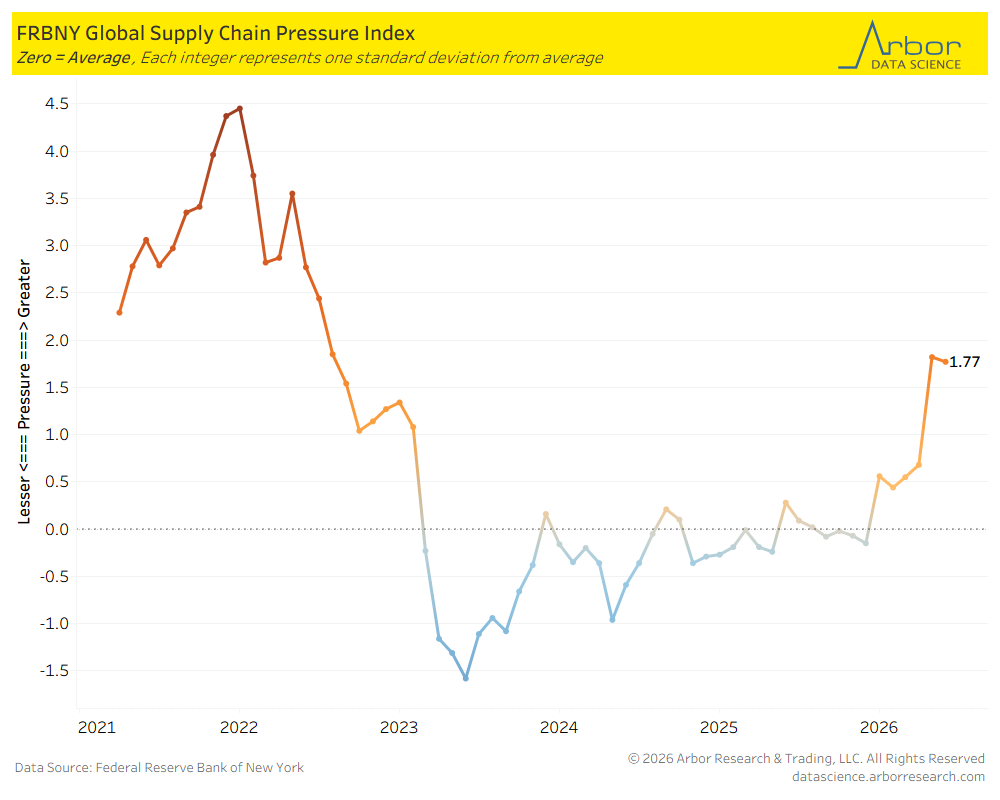
Global Supply Chain Pressure Index
- The Federal Reserve Bank of New York’s Global Supply Chain Pressure Index (GSCPI) decreased from 1.82 in April 2026 to 1.77 in May 2026.
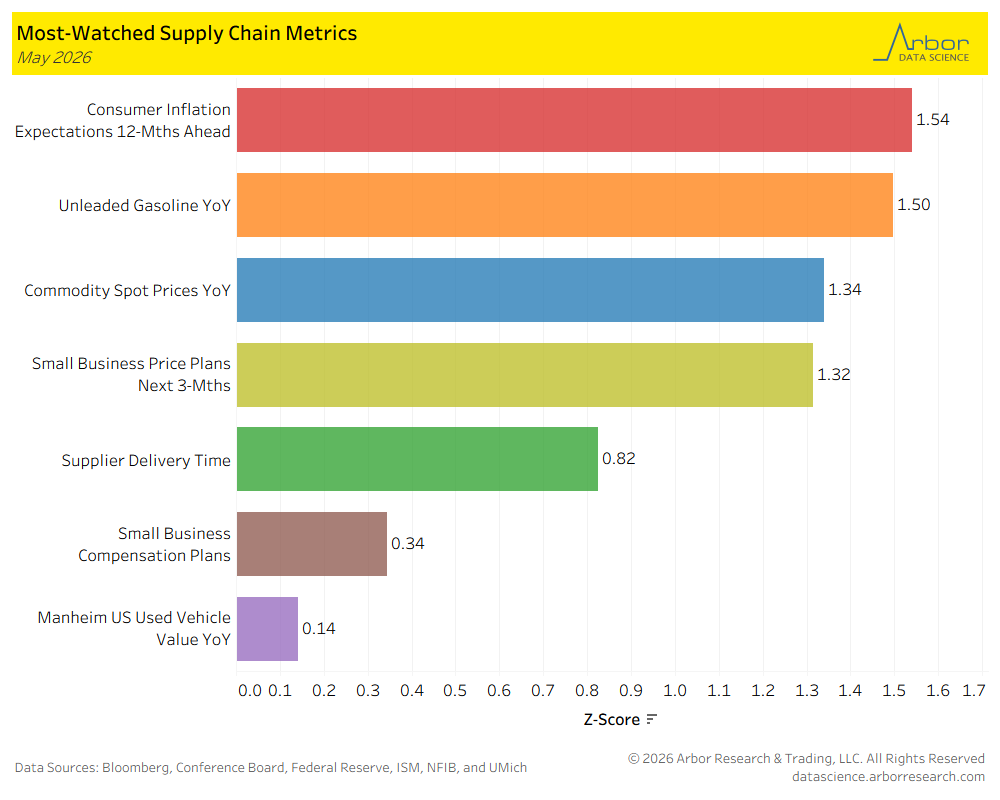
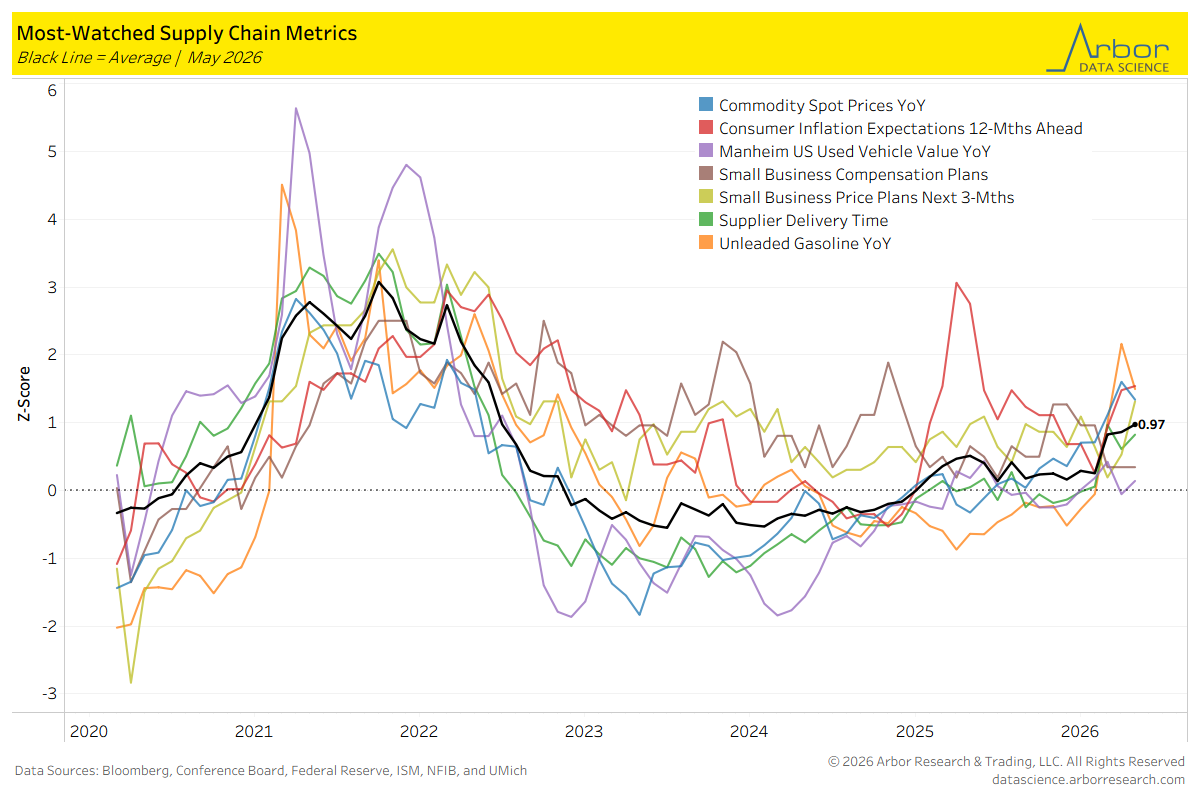
Most-Watched Supply Chain Metrics
- The chart below is a breakdown of supply chain metrics for May 2026.
- The aggregate index of most-watched supply chain metrics (the black line in the chart below) was 0.97, with zero meaning the supply chain is acting normally.
Tables