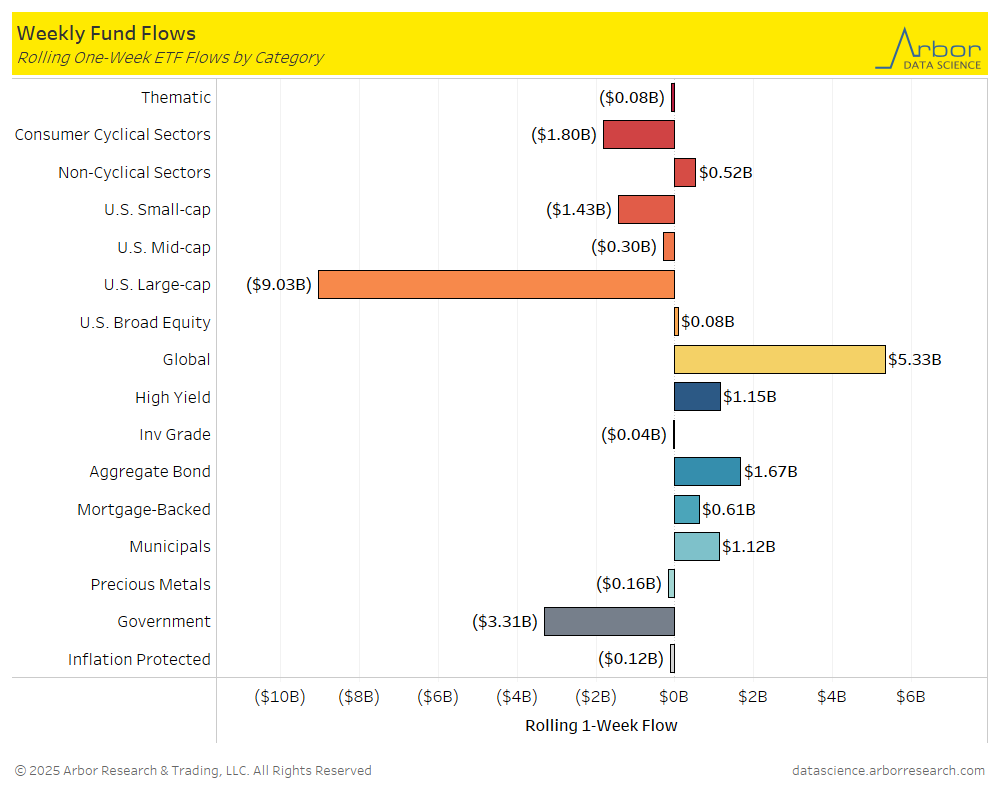
- The top two movers of the week were U.S. Mortgage-Backed ETFs and U.S. Large Cap ETFs for the week ended on 5/02/25.
- On a weekly basis, U.S. Mortgage-Backed ETFs had inflows of approximately $0.61 billion for the week ended 5/02/25, compared to outflows of $4.80 billion for the week ended on 4/25/25.
- On a weekly basis, U.S. Large-Cap ETFs had outflows of approximately $9.03 billon for the week ended 05/02/25, compared to outflows of $4.77 billion for the week ended on 4/25/25.
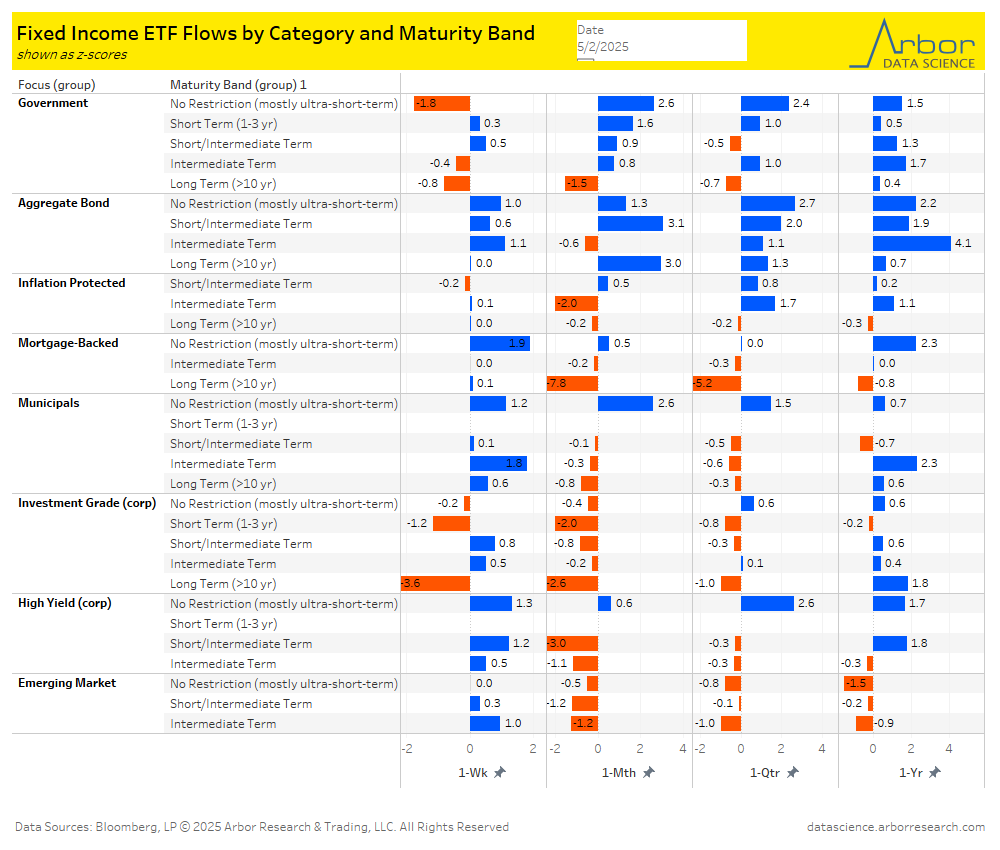
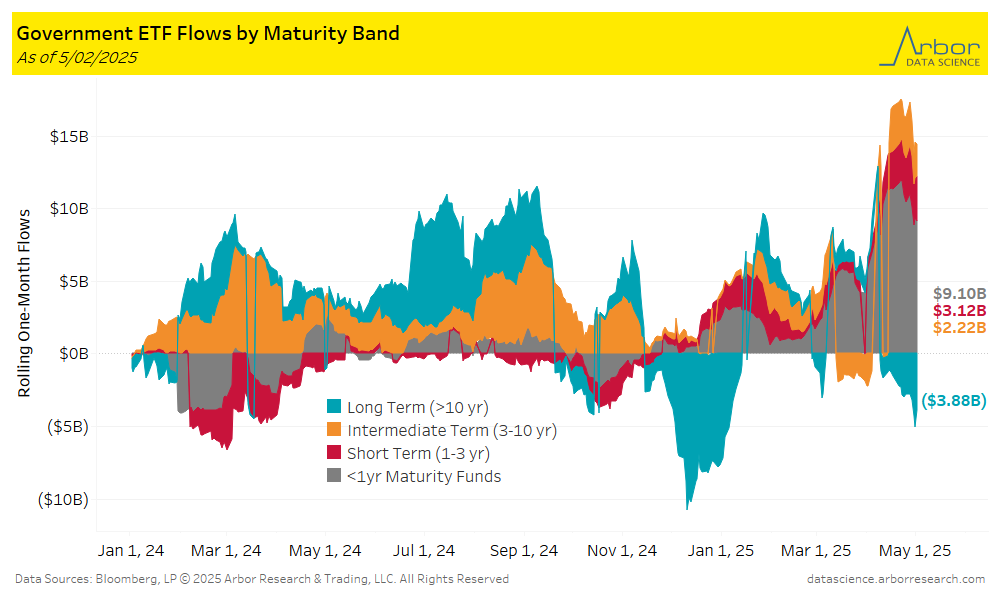
- Long Term (>10 yr) ETFs had outflows of $3.88 billion over the last week. The largest inflows were $9.10 billion in <1 year Maturity Fund ETFs over the same time period.
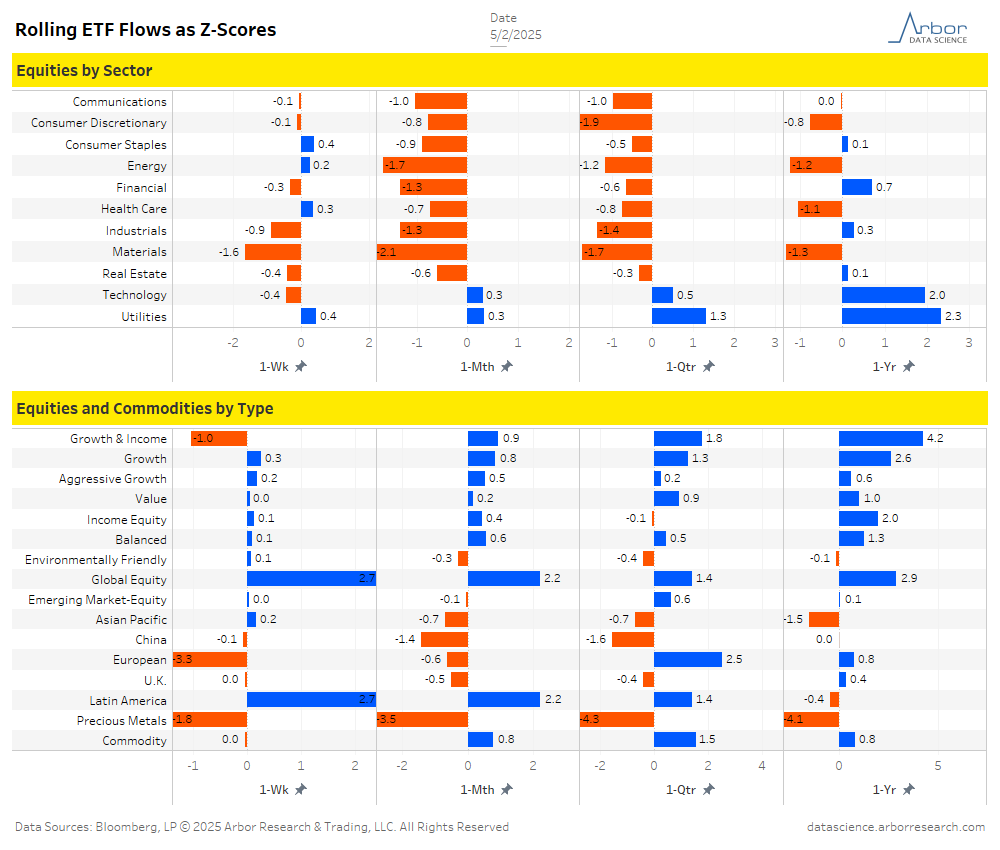
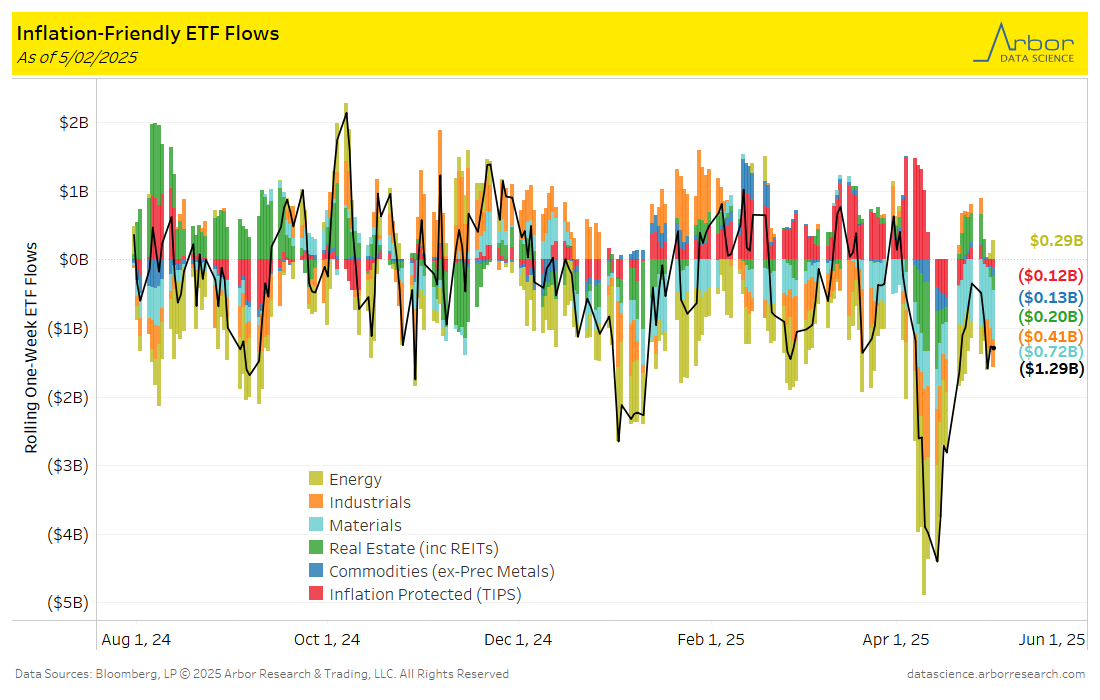
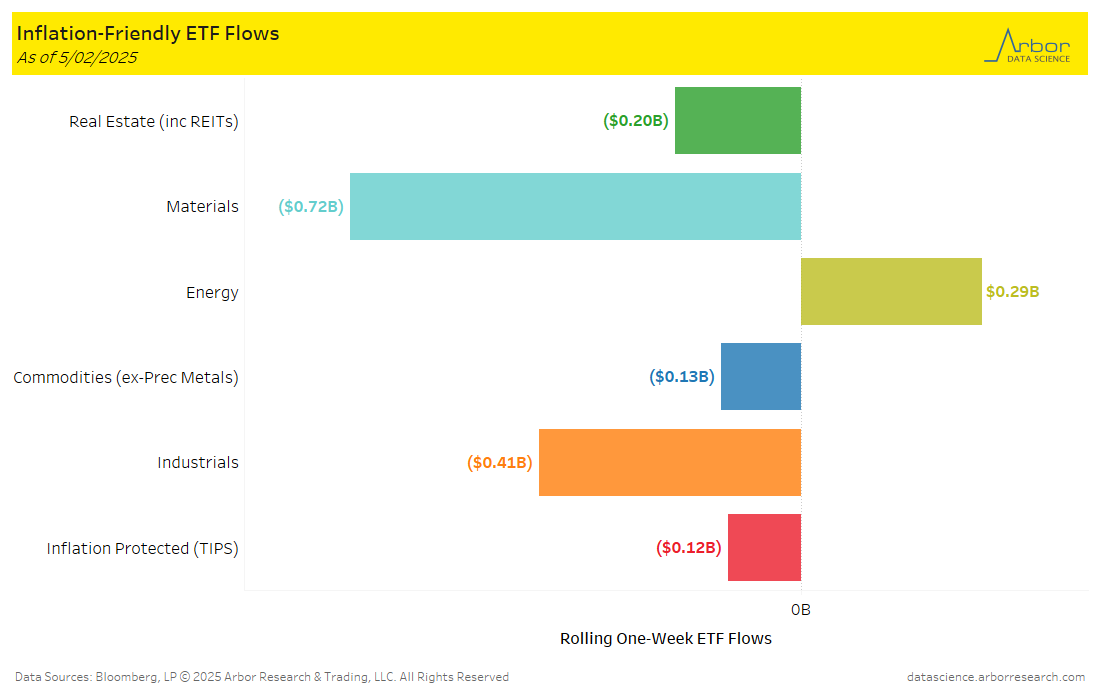
- Aggregate flows (black line in chart below) were mostly negative for the week ended 5/02/25, with $1.29 billion of outflows. Materials had the largest outflows for the week at $0.72 billion. Industrials had the second largest outflows for the week at $0.41 billion. The only inflows were in Energy at $0.29 billion.
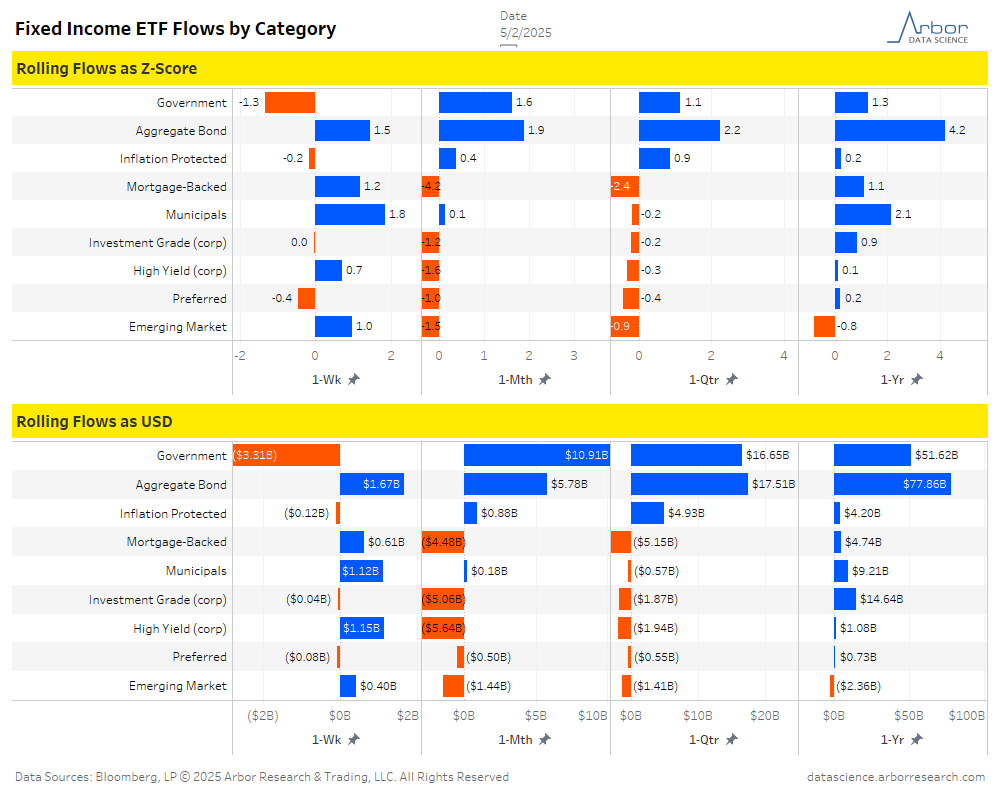
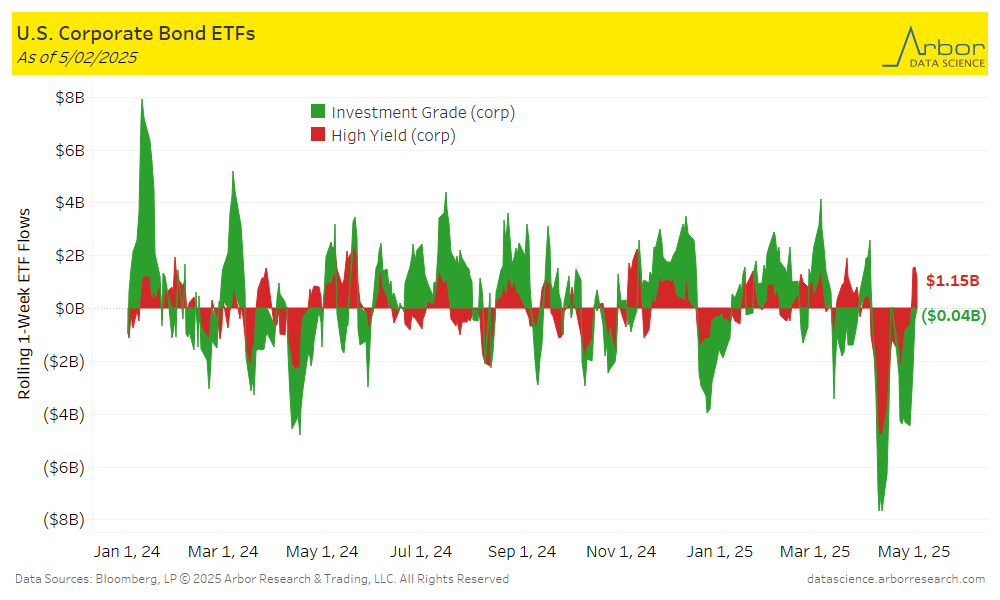
- Corporate bond ETFs were negative for the week ended 5/02/25, with Investment-Grade ETFs losing $0.04 billion and High-Yield ETFs gaining $1.15 billion.
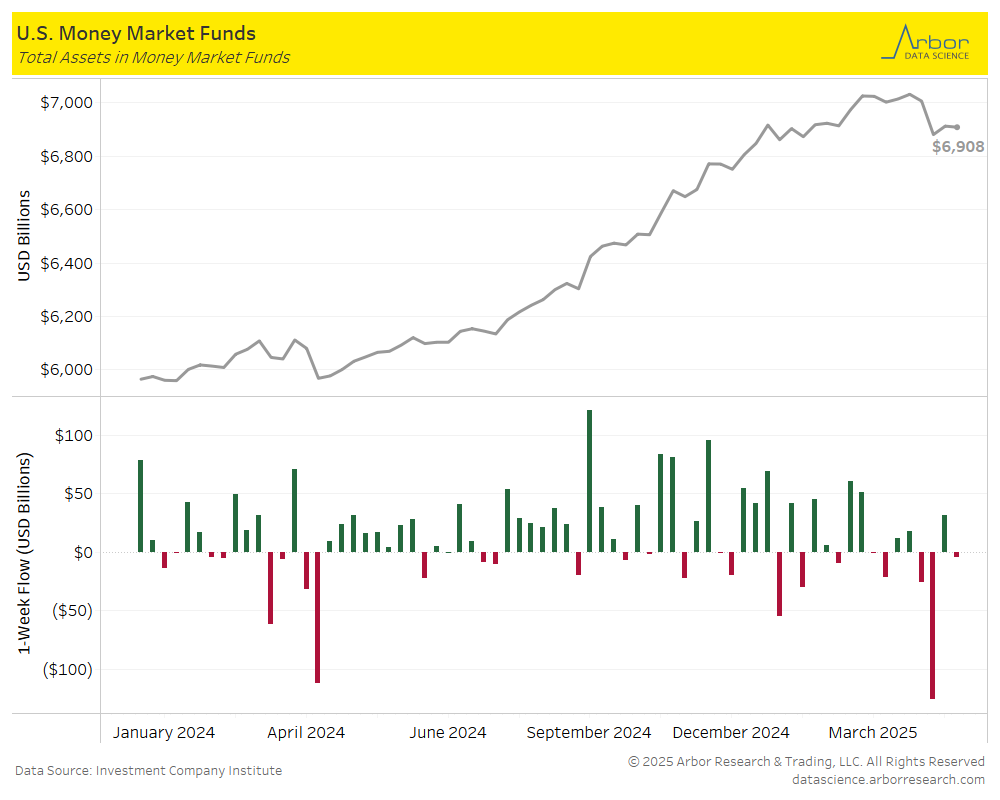
- The amount invested in Money-Market Mutual Funds (MMMFs) decreased to $6.908 trillion in total assets on 4/30/25, compared to $6.913 trillion the prior week.
Tables