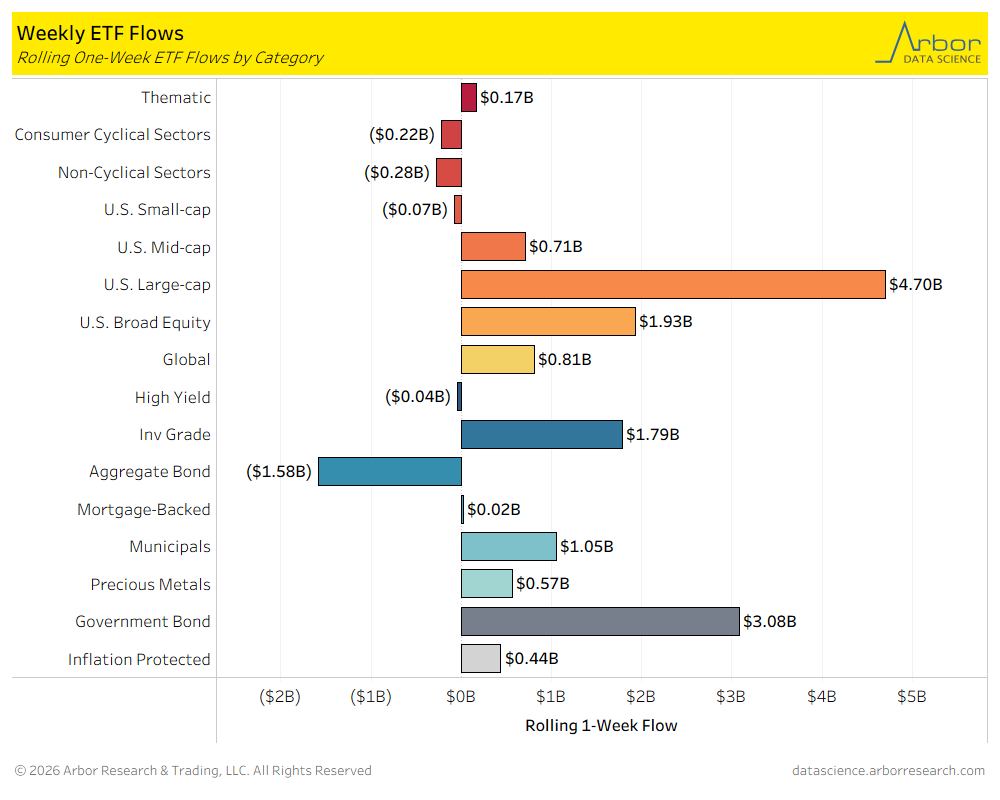
- Of the 16 ETF categories charted below, 11 categories had net inflows for the week that ended on 04/02/2026.
- The three ETF categories with the largest inflows for the week that ended on 04/02/2026 were U.S. Large Cap ETFs at $4.70 billion, Government Bond ETFs at $3.08 billion, and U.S. Broad Equity ETFs at $1.93 billion.
- The ETF category with the largest outflow for the week that ended on 04/02/2026 was Aggregate Bond ETFs at $1.58 billion in outflows.
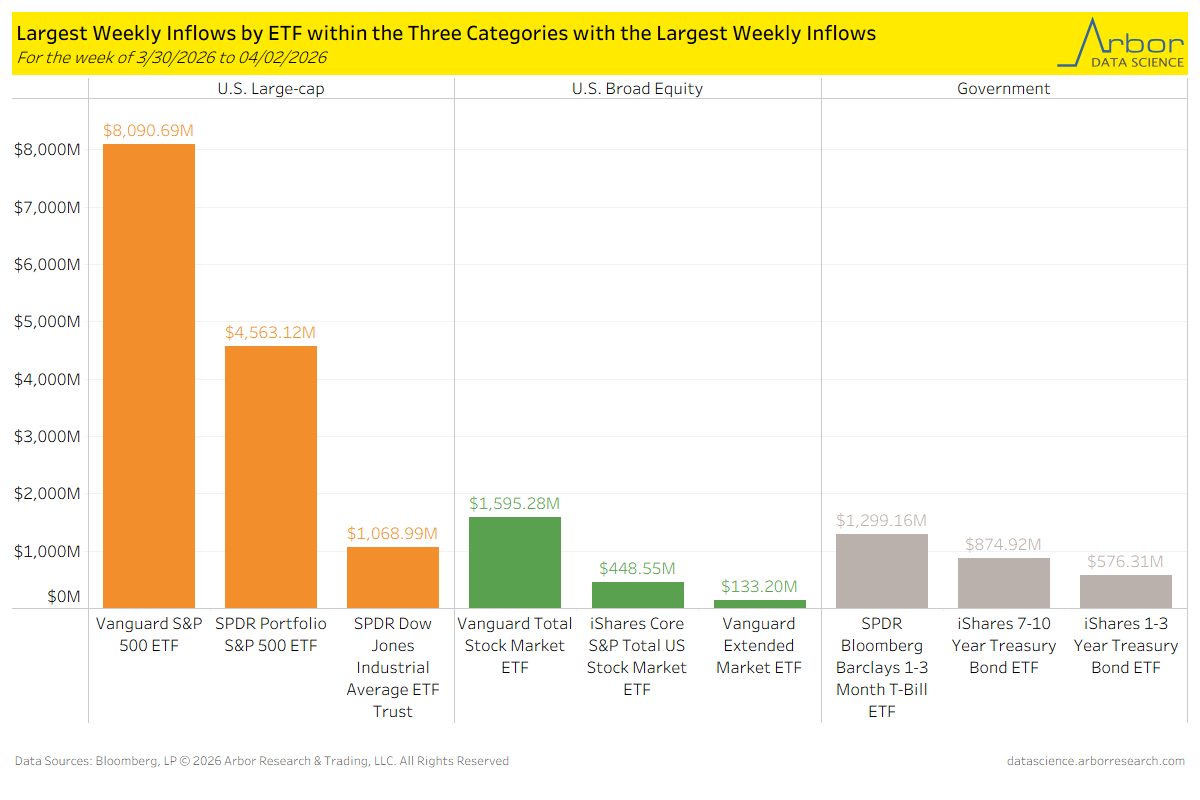
- Below, we highlight the three ETF categories with the largest inflows and the ETFs within those categories for the week of 03/30/2026 to 04/02/2026.
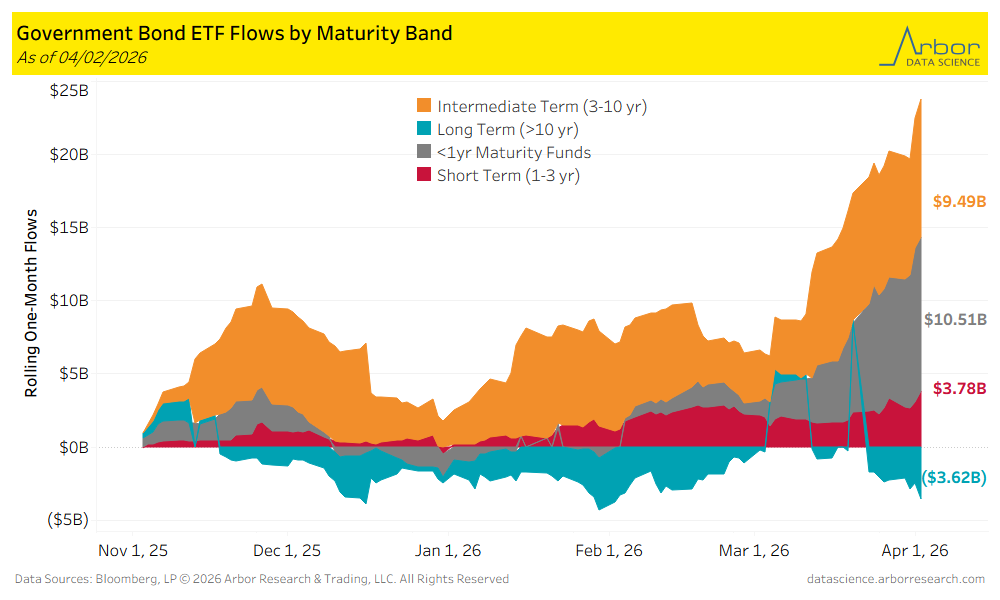
- Long Term (>10 yr) bond ETFs had outflows of $3.62 billion over the last month. The largest inflows were $10.51 billion in <1yr Maturity Funds.
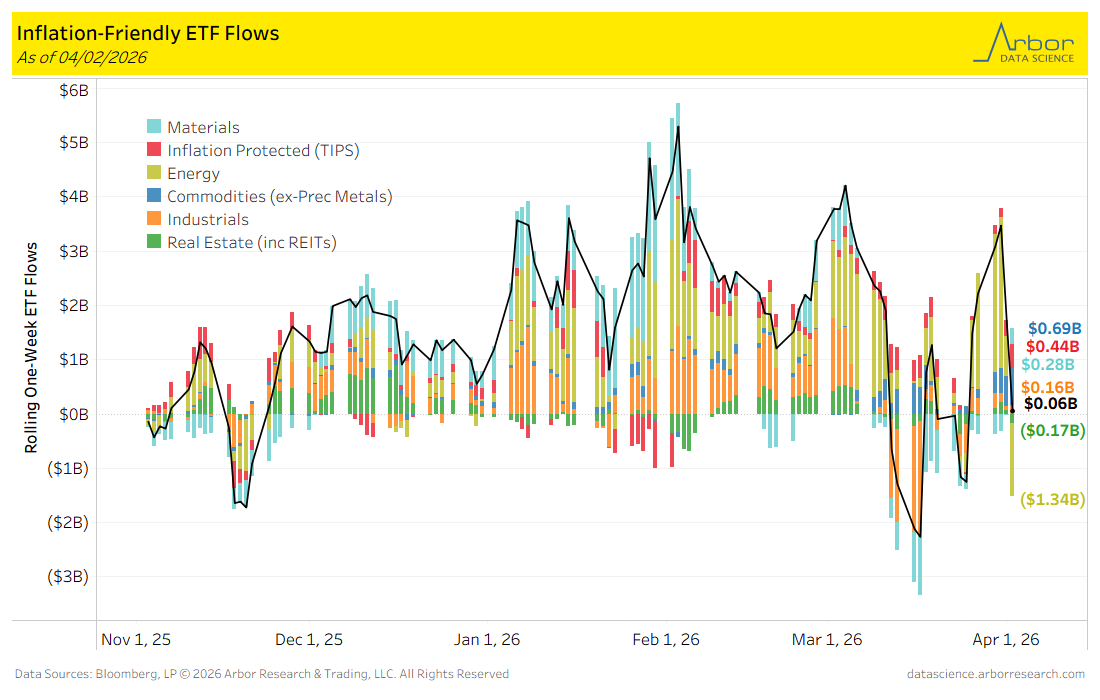
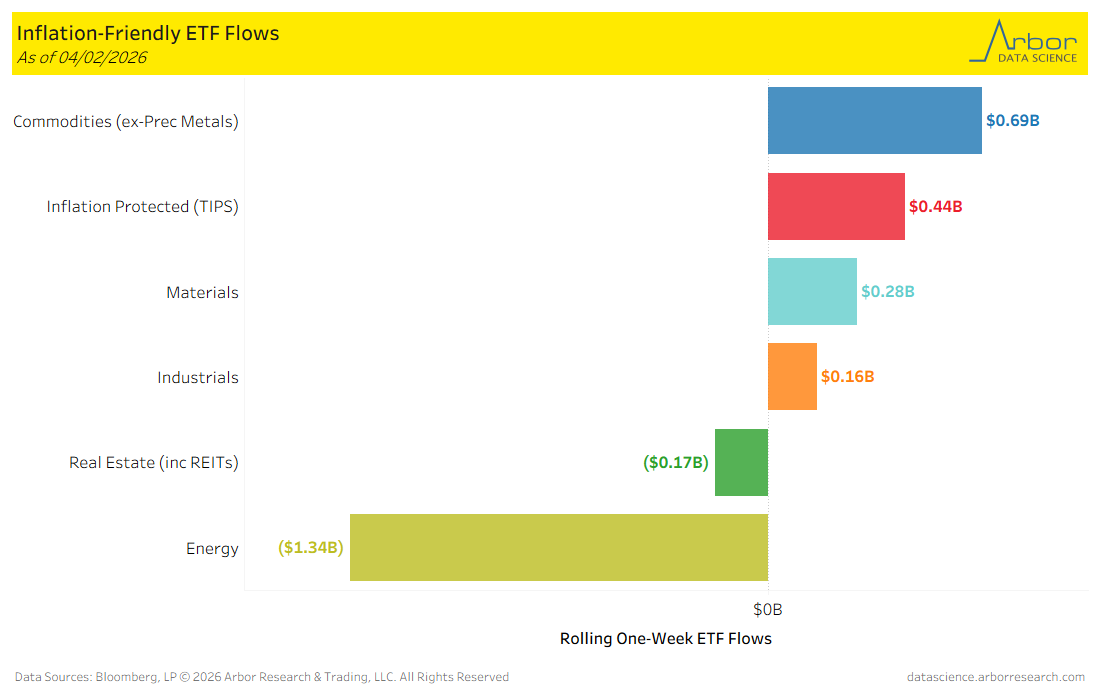
- Turning to inflation-friendly ETFs, aggregate flows (black line in chart below) were positive for the week ended 04/02/2026, with $0.06 billion of inflows. Commodities had the largest inflows for the week at $0.69 billion.
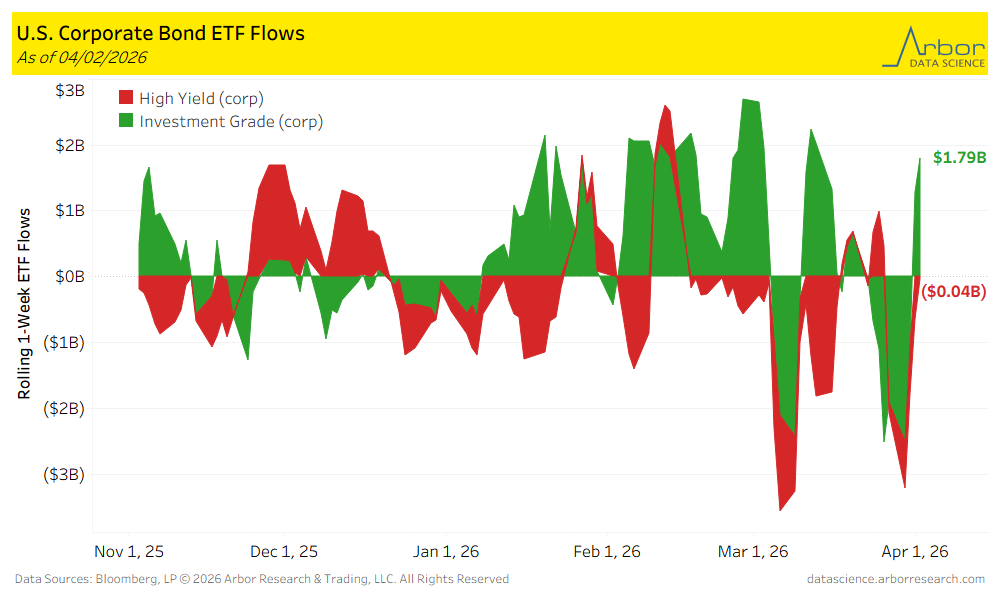
- Corporate bond ETF flows were mixed for the week ended 04/02/2026, with High-Yield ETFs losing $0.04 billion and Investment-Grade ETFs gaining $1.79 billion.
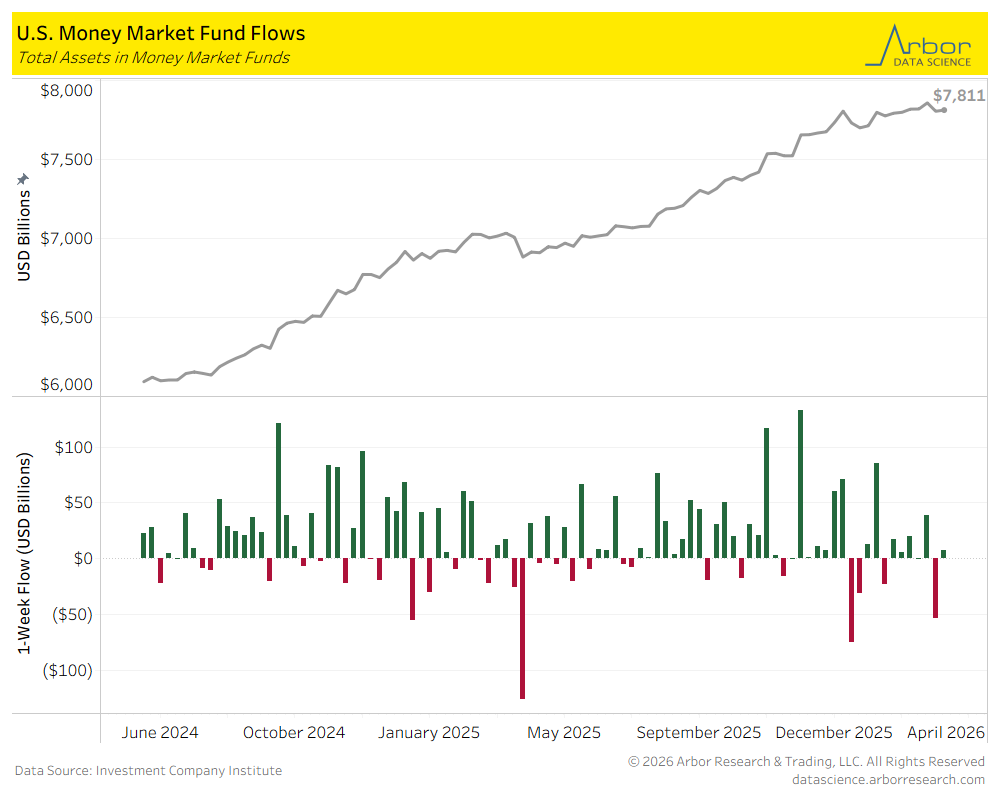
- The amount invested in Money-Market Mutual Funds (MMMFs) increased to $7.811 trillion in total assets on 04/01/2025, compared to $7.803 trillion in total assets on 03/25/2026.