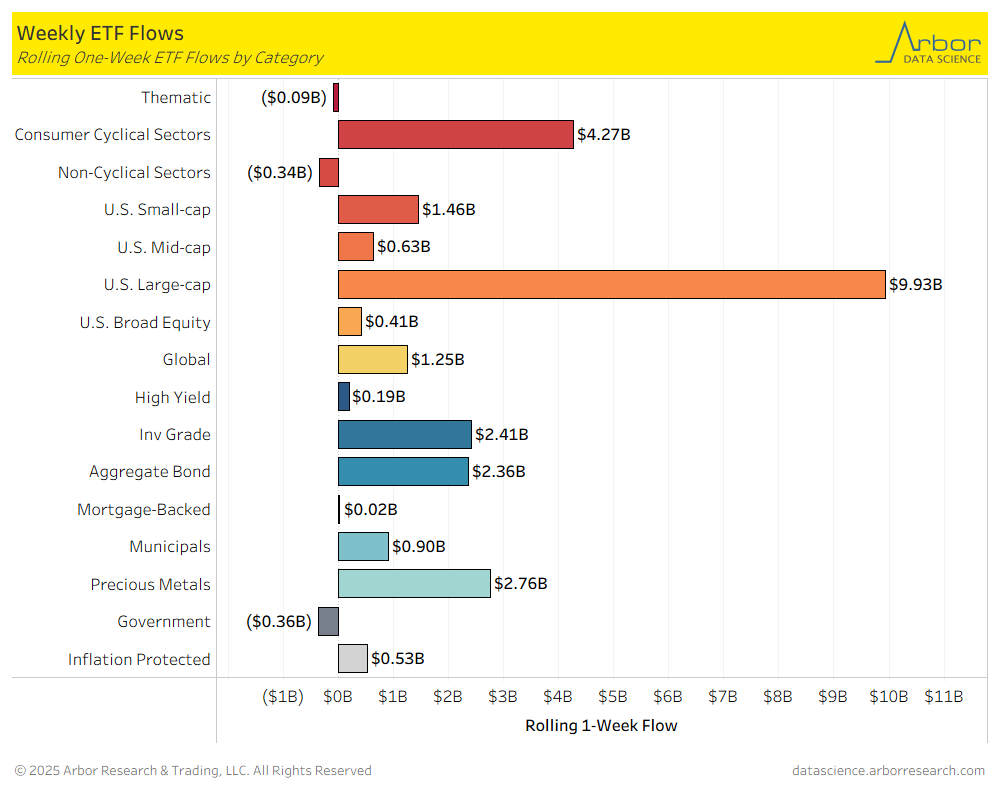
- Of the 16 ETF categories charted below, 13 categories had net inflows for the week that ended on 8/29/2025.
- The two ETF categories with the largest inflows for the week that ended on 8/29/2025 were U.S. Large Cap ETFs, at $9.93 billion in inflows, and Consumer Cyclical Sectors ETFs, at $4.27 billion in inflows.
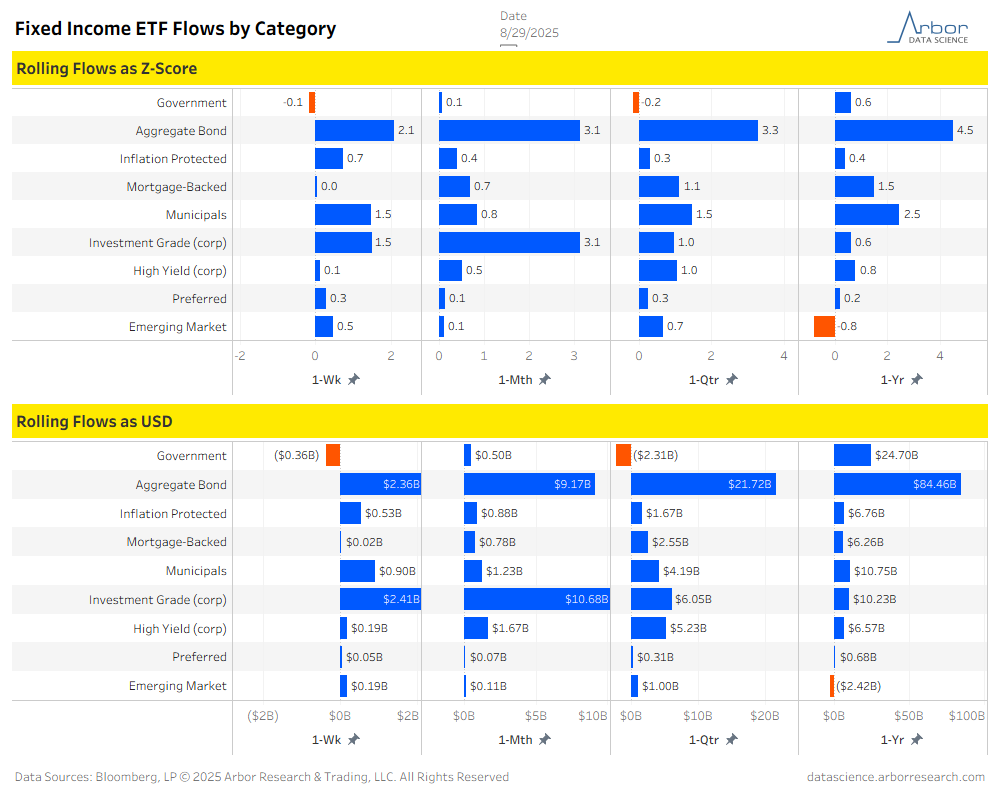
- The ETF category with the largest outflow for the week that ended on 8/29/2025 was Government ETFs at $0.36 billion in outflows.
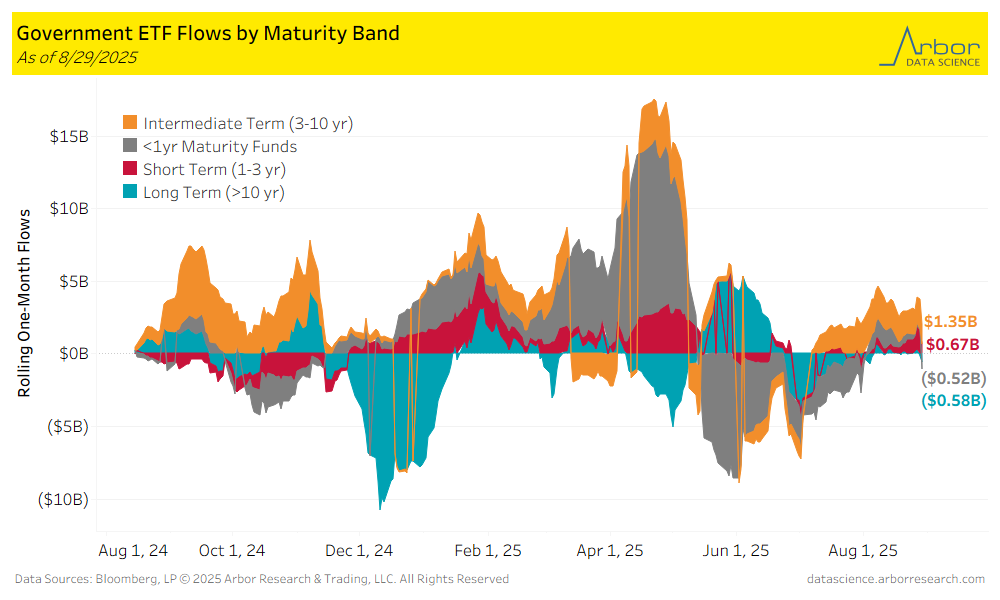
- Long Term (>10 yr) ETFs had outflows of $0.58 billion over the last week. The largest inflows were $1.35 billion in Intermediate Term (3-10 yr) ETFs, followed by $0.67 billion inflows in Short Term (1-3 yr) ETFs over the same time period.
- Aggregate flows (black line in chart below) were positive for the week ended 8/29/25, with $1.27 billion of inflows. Materials had the largest inflows for the week at $0.67 billion. Energy had the largest outflows at $0.08 billion.
.png)
.png)
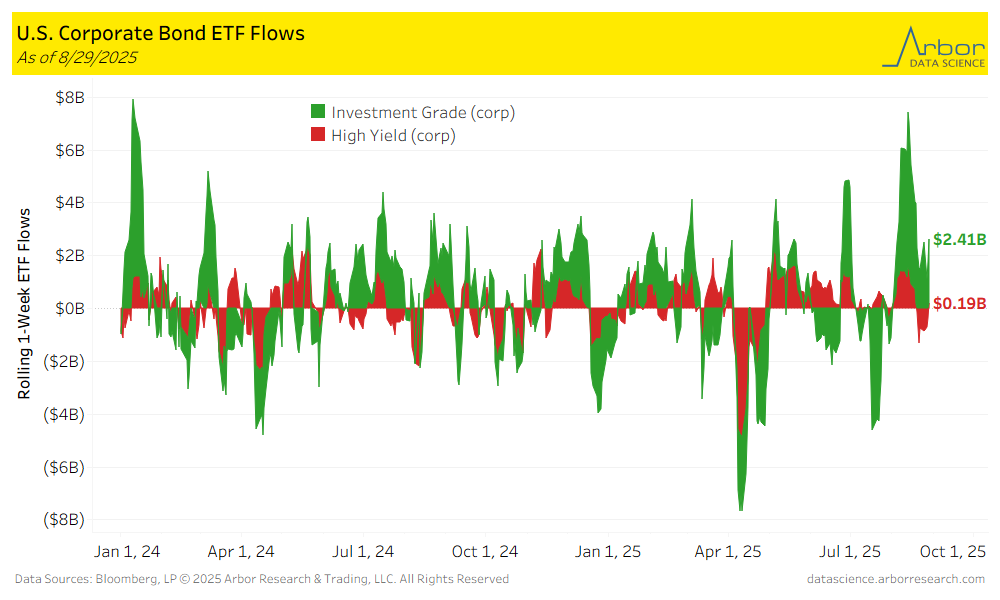
- Corporate bond ETFs were positive for the week ended 8/29/25, with Investment-Grade ETFs gaining $2.41 billion and High-Yield ETFs gaining $0.19 billion.
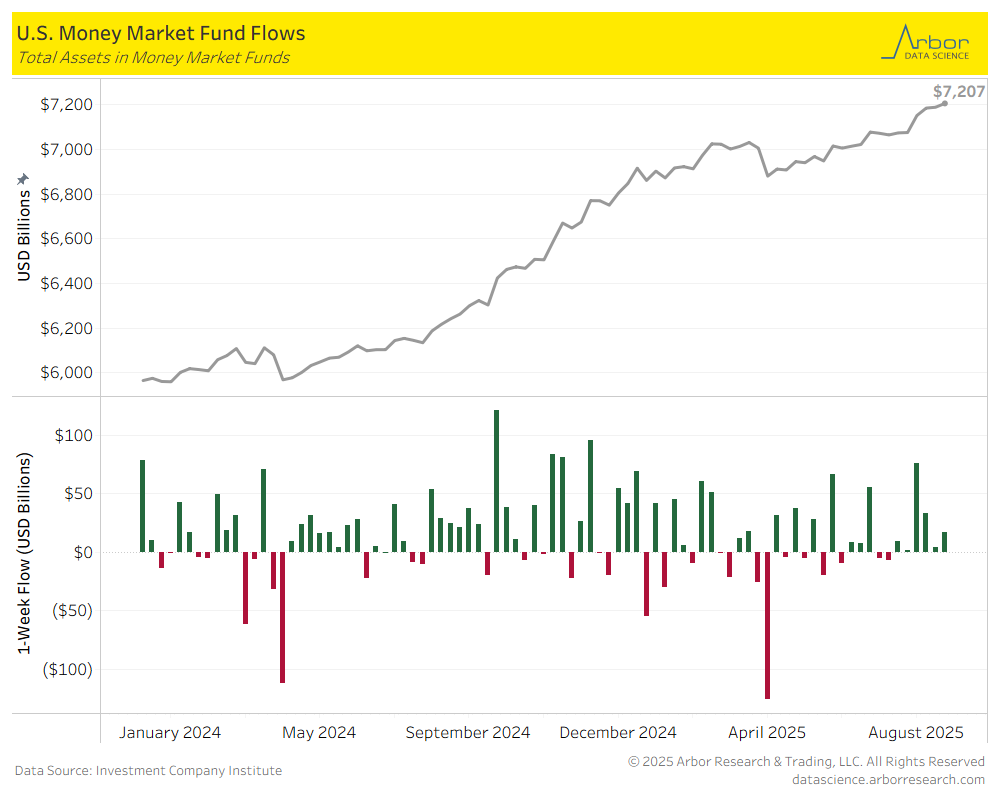
- The amount invested in Money-Market Mutual Funds (MMMFs) increased to $7.207 trillion in total assets on 8/27/2025, compared to $7.190 trillion in total assets on 8/20/25.
Tables
.png)