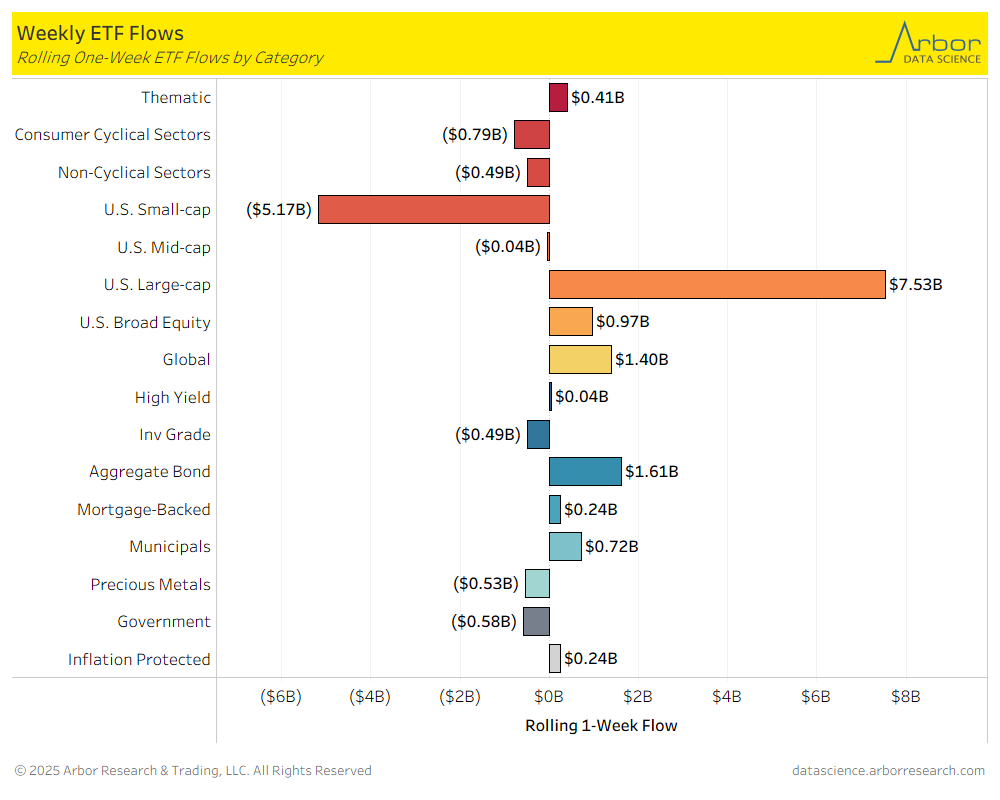
- Of the 16 ETF categories charted below, 9 categories had net inflows for the week that ended on 7/25/2025.
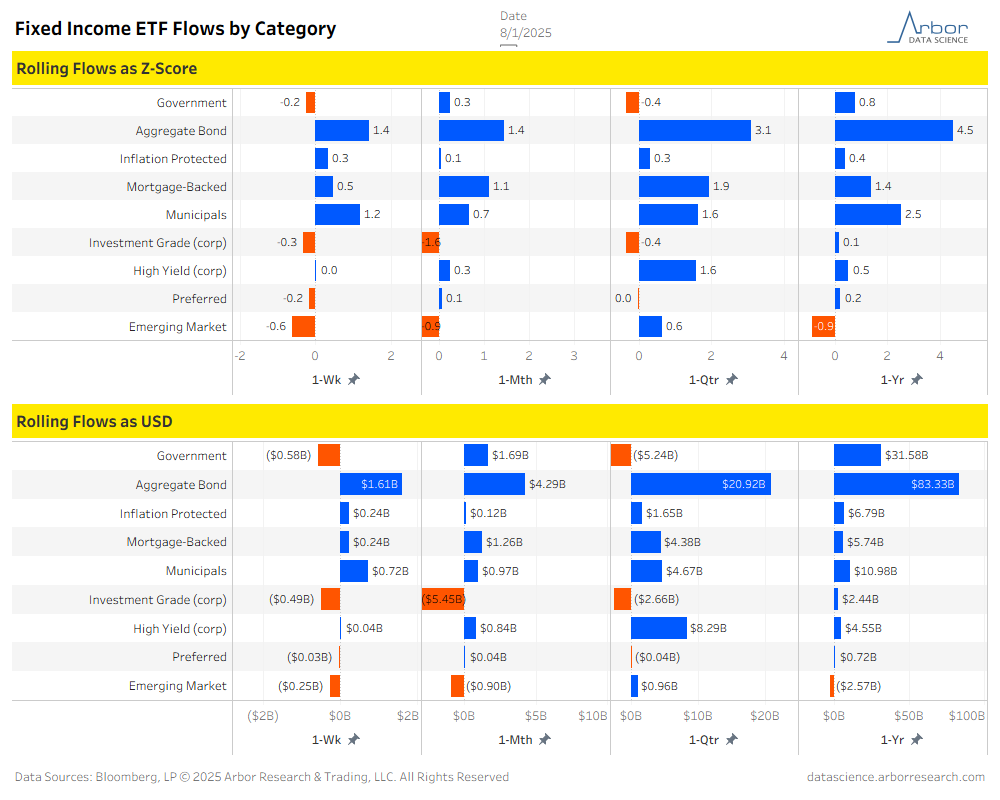
- The two ETF categories with the largest inflows for the week that ended on 8/1/2025 were U.S. Large-Cap ETFs, at $7.53 billion in inflows, and Precious Aggregate Bond ETFs, at $1.61 billion in inflows.
- The ETF category with the largest outflow for the week that ended on 8/1/2025 was U.S. Small Cap ETFs at $5.17 billion in outflows.
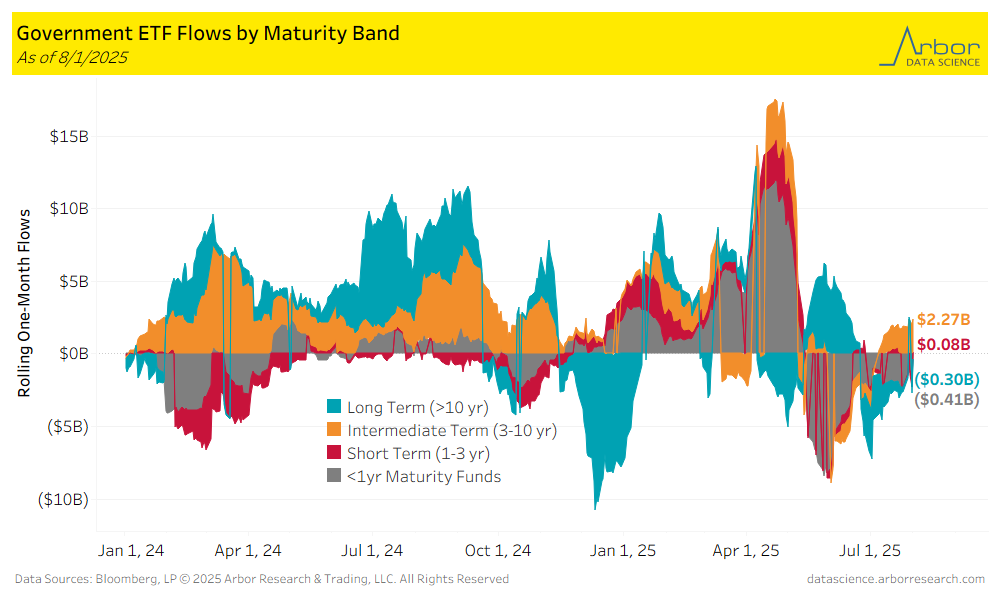
- Long Term (>10 yr) ETFs had outflows of $0.30 billion over the last week. The largest outflows were $0.41 billion in <1 year Maturity Fund ETFs, and the largest inflows were $2.27 billion in Intermediate Term (3-10 yr) ETFs over the same time period.
- Aggregate flows (black line in chart below) were positive for the week ended 8/1/25, with $0.32 billion of inflows. Industrials had the largest inflows for the week at $0.47 billion. Energy had the largest outflows at $0.22 billion.
.png)
.png)
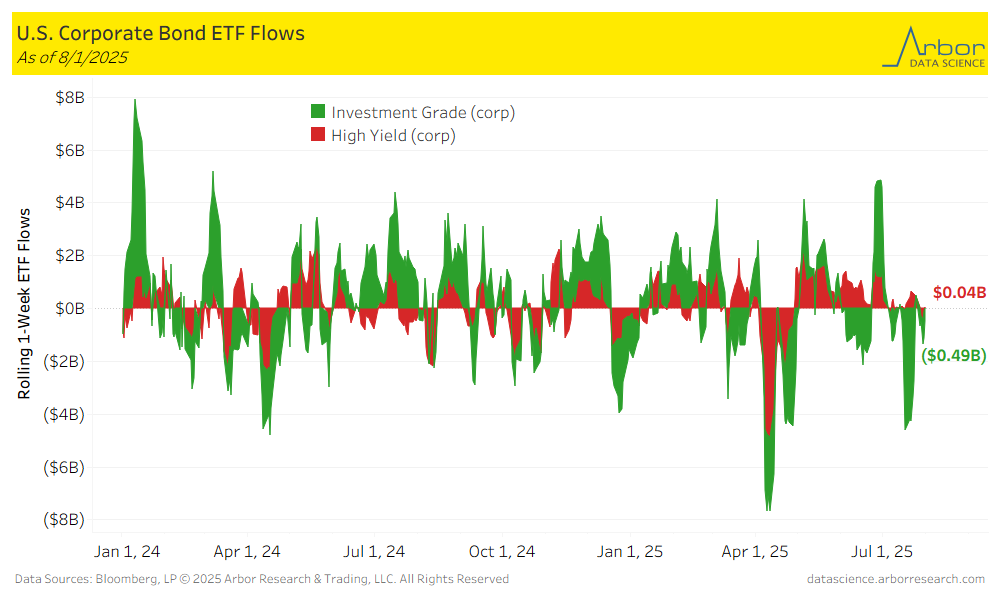
- Corporate bond ETFs were mixed for the week ended 8/1/25, with Investment-Grade ETFs losing $0.49 billion and High-Yield ETFs gaining $0.04 billion.
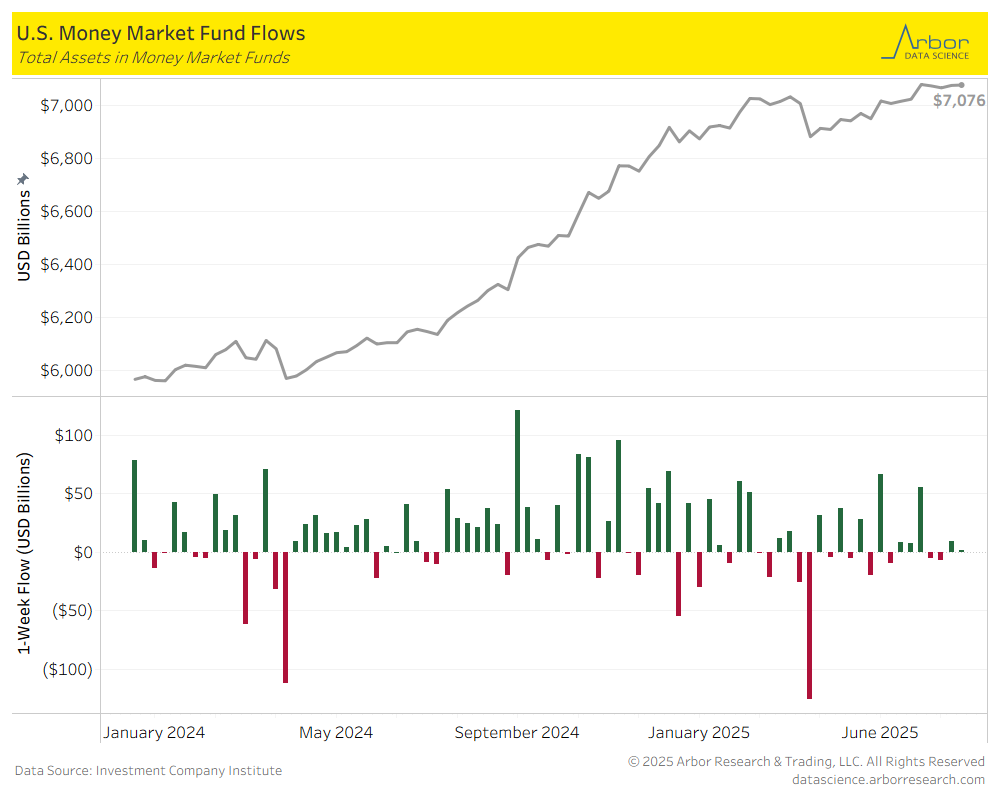
- The amount invested in Money-Market Mutual Funds (MMMFs) increased sligthly to $7.076 trillion in total assets on 7/30/2025, compared to $7.075 trillion in total assets on 7/23/25.
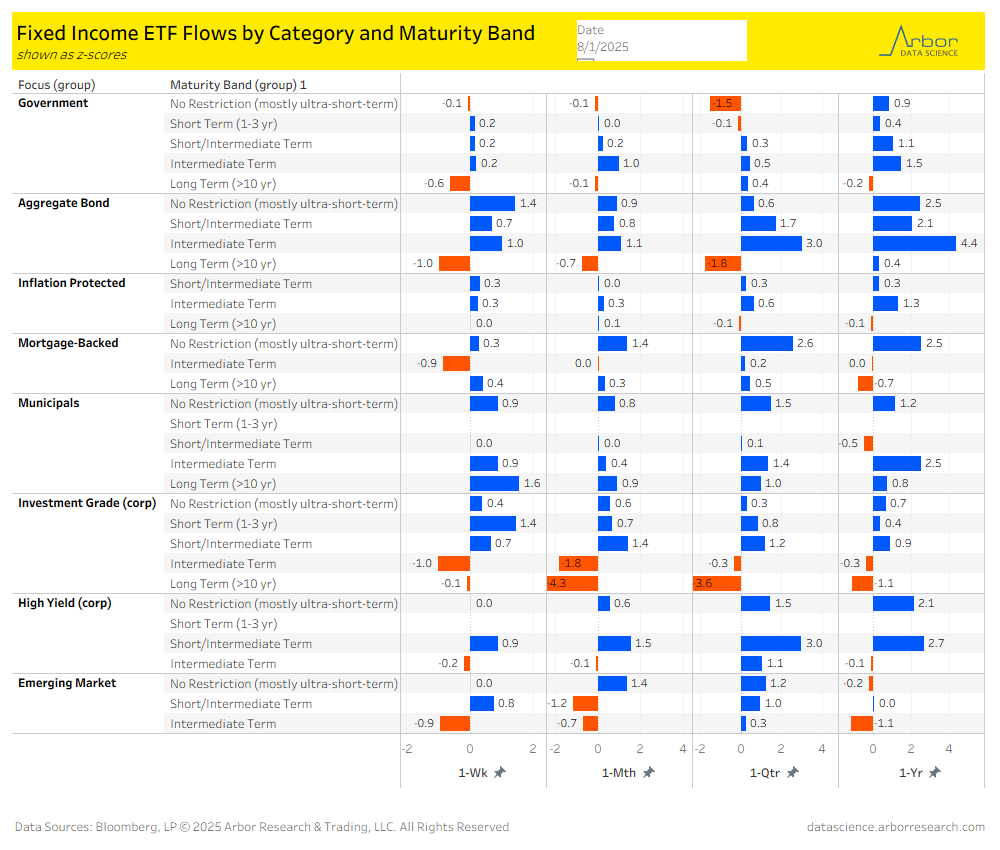
Tables
.png)