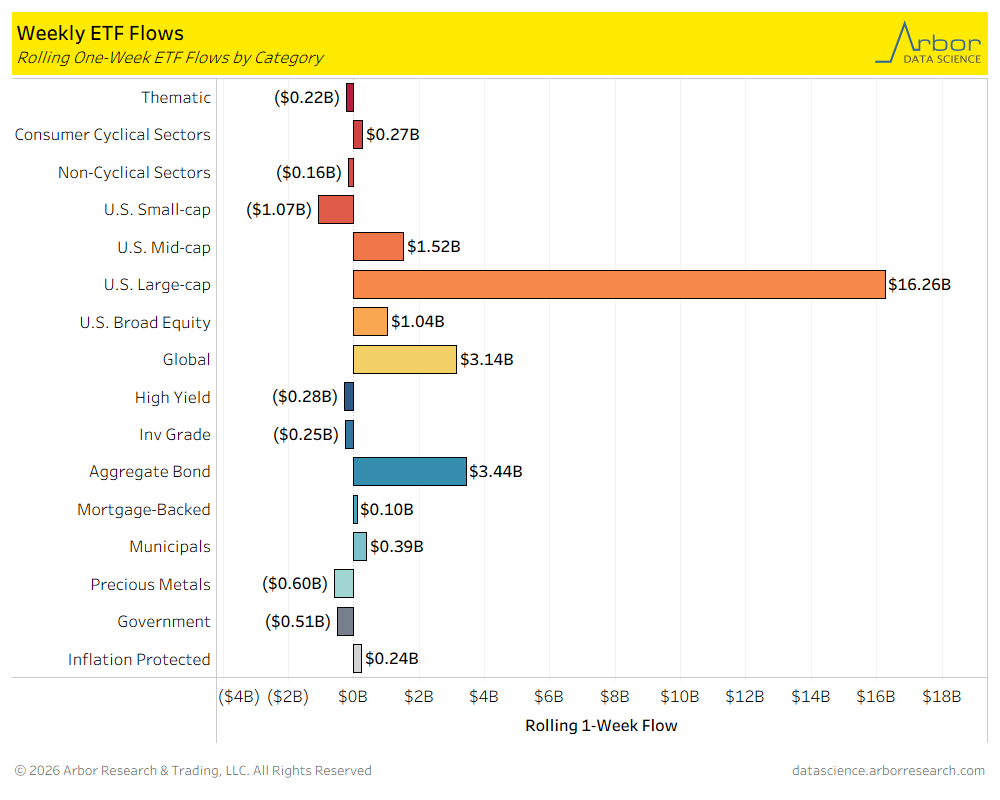
- Of the 16 ETF categories charted below, 9 categories had net inflows for the week that ended on 01/02/2026.
- The three ETF categories with the largest inflows for the week that ended on 01/02/2026 were U.S. Large-cap ETFs at $16.26 billion, Aggregate Bond ETFs at $3.44 billion, and Global ETFs at $3.14 billion.
- The ETF category with the largest outflow for the week that ended on 01/02/2026 was U.S. Small-cap ETFs at $1.07 billion in outflows.
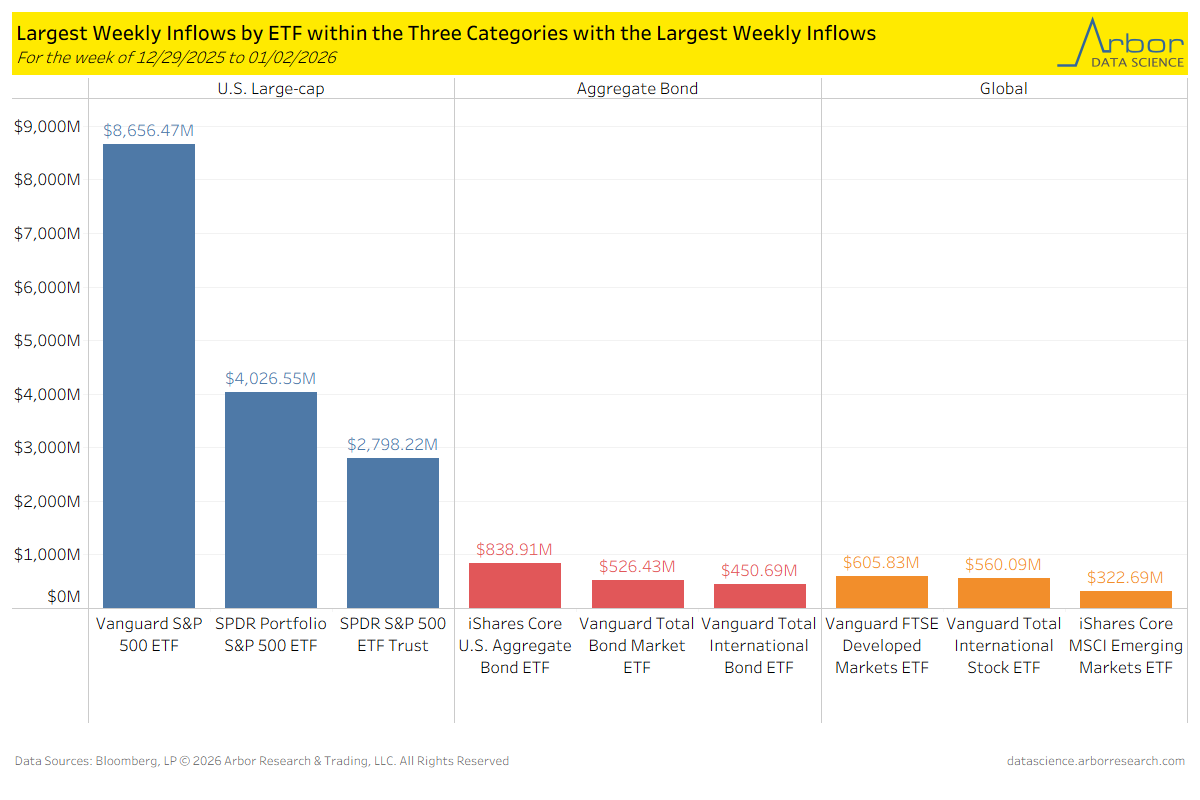
- Below, we highlight the three ETF categories with the largest inflows and the ETFs within those categories for the week of 12/29/2025 to 01/02/2026.
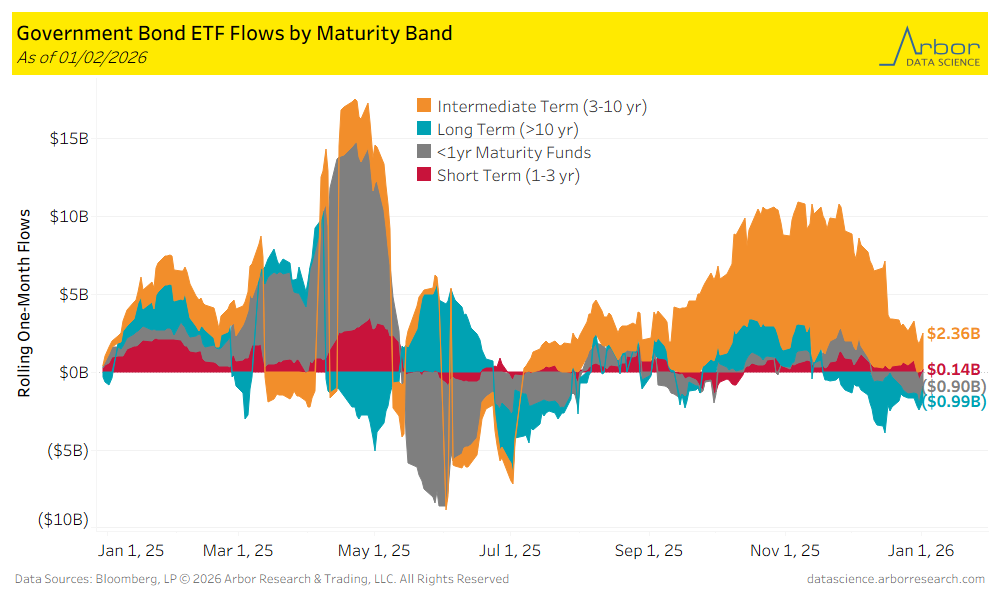
- Long Term (>10 yr) bond ETFs had outflows of $0.99 billion over the last month. The largest inflows were $2.36 billion in Intermediate Term (3-10 yr) ETFs.
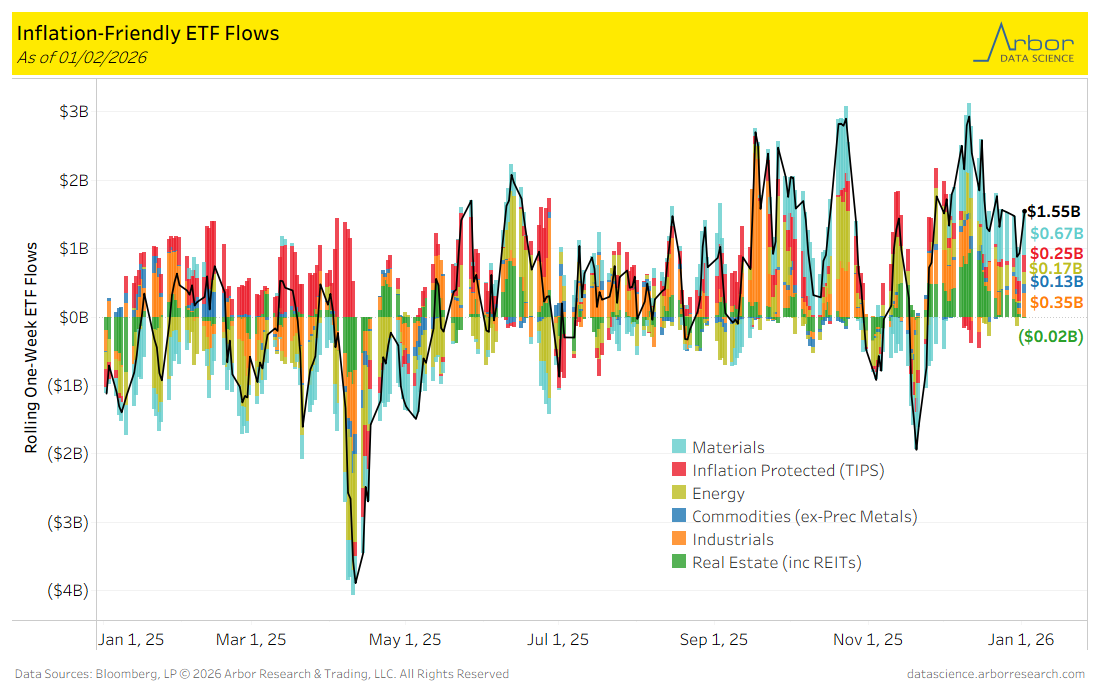
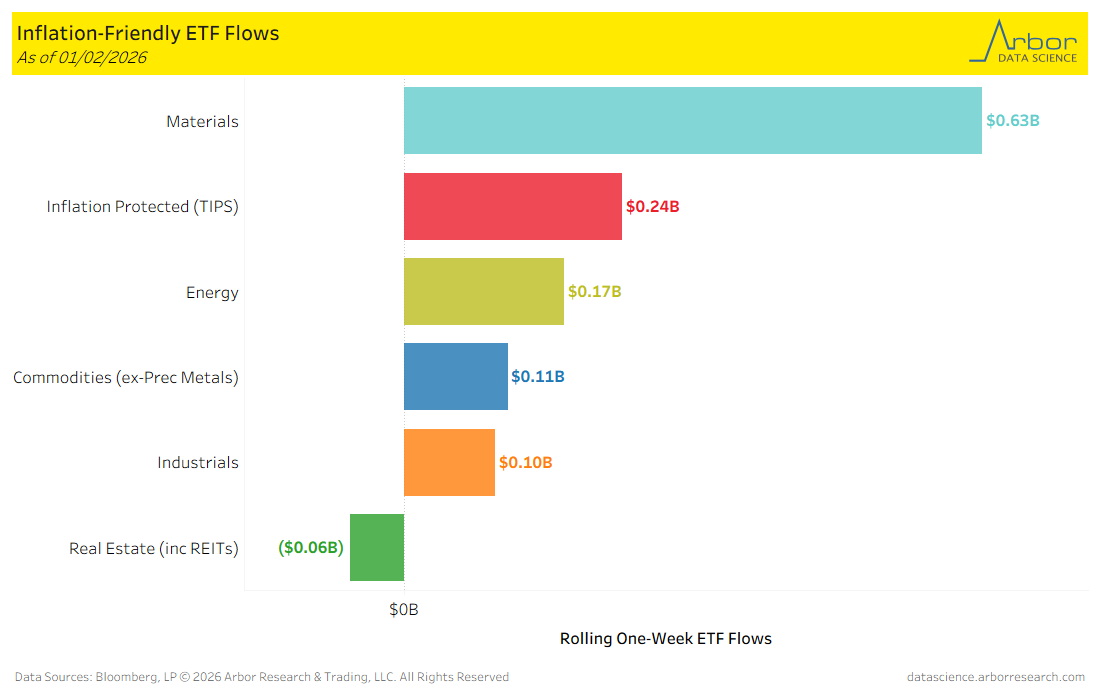
- Turning to inflation-friendly ETFs, aggregate flows (black line in chart below) were positive for the week ended 01/02/2026, with $1.19 billion of inflows. Materials had the largest inflow for the week at $0.63 billion.

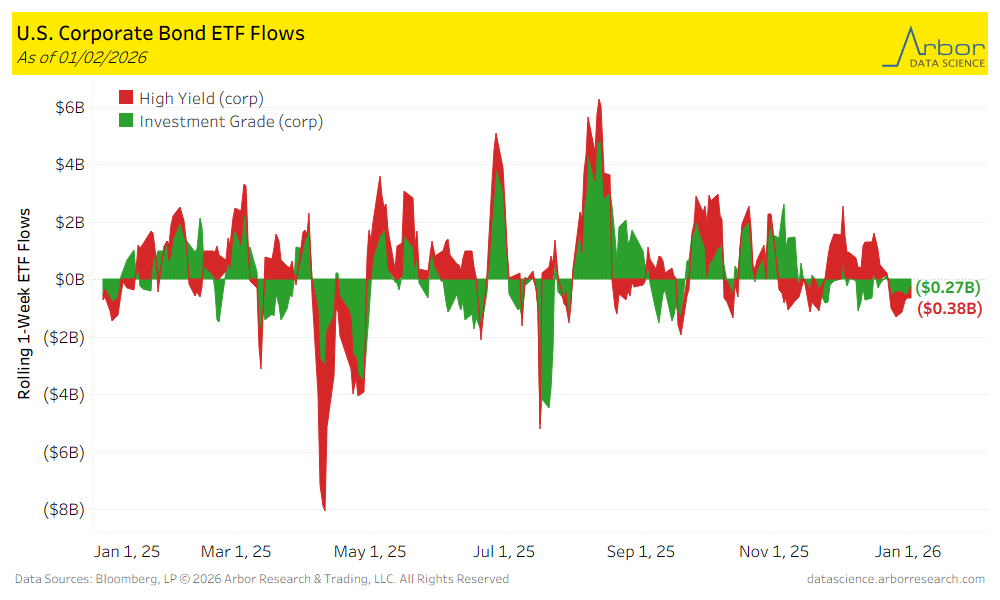
- Corporate bond ETF flows were negative for the week ended 01/02/2026, with High-Yield ETFs losing $0.28 billion and Investment-Grade ETFs losing $0.25 billion.
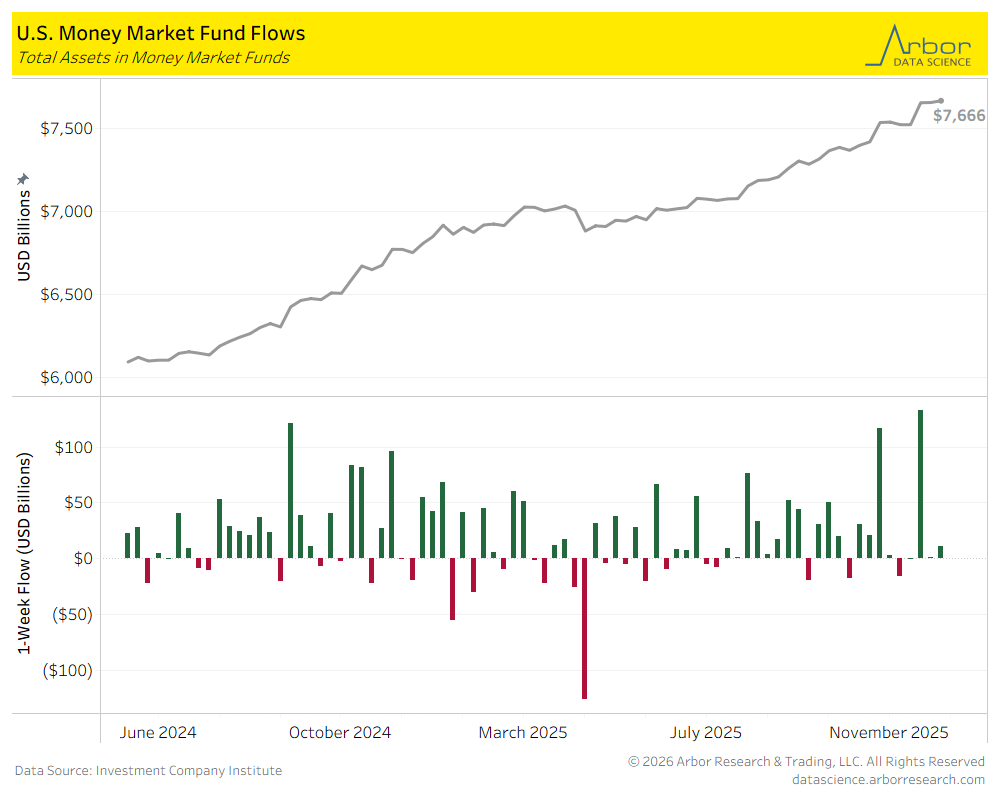
- The amount invested in Money-Market Mutual Funds (MMMFs) increased to $7.666 trillion in total assets on 12/17/2025, compared to $7.655 trillion in total assets on 12/10/2025. This data has not yet been updated for 12/31/2025.