


All anyone seems to care about is trying to bottom time AI themes. Meanwhile, if we take a look across the metals, some of these charts are starting to look really good in the medium term.
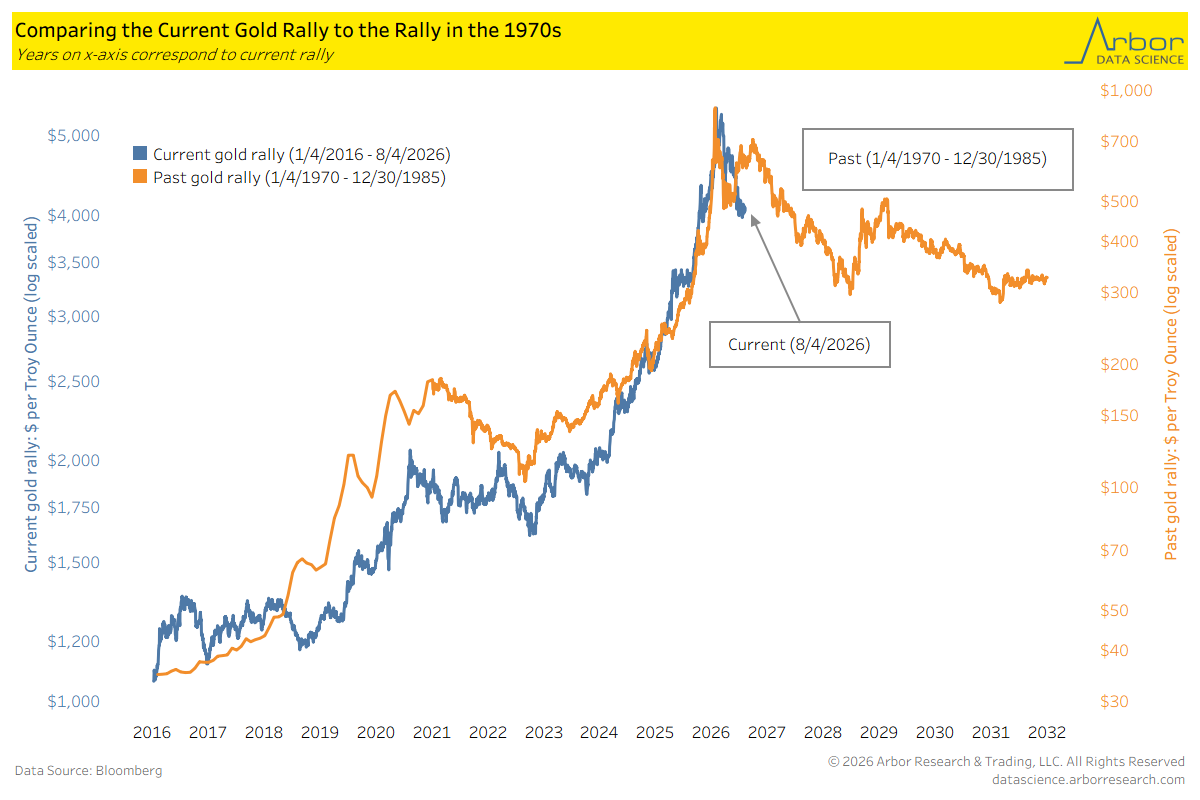
The first chart is going to be that 1970s analog gold rally that we have been tracking since the Hunt Brothers squeeze. So far, that has been playing out extremely well. It does appear that we are probably overdue for some kind of bottoming dead cat bounce here in the medium term. By “dead cat,” I mean a pretty significant bounce if we agree following the analog.
The last time it was like this, it retraced almost half its drawdown. Are we expecting the same amount here? No. But the risk-reward is quite compelling. If it is right, we can predict the chain, we can predict the phase transition, but it is hard for us to predict the rate of change if we do end up bouncing.
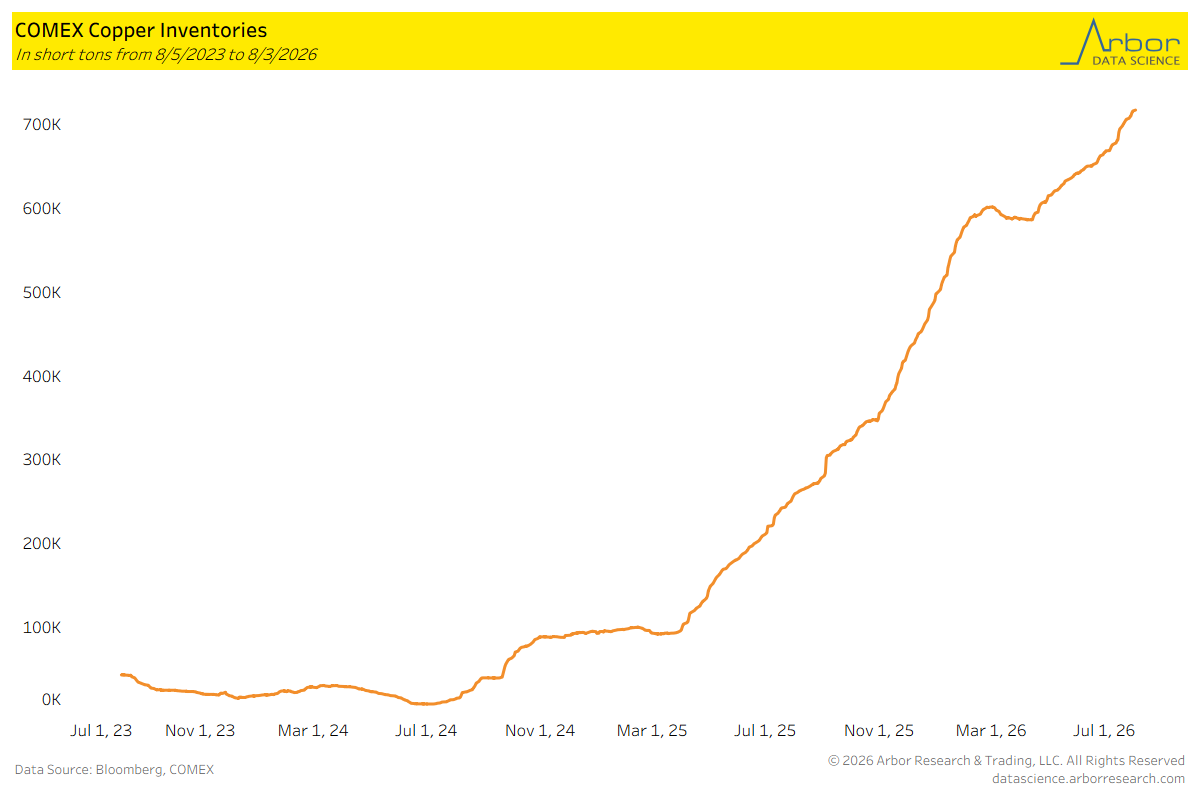
The next chart illustrates the massive amount of copper inventories and stacking that have been transpiring over the last year or so. We have beaten the whole shortage and supply shock to death with prior research at this point. But, this COMEX inventory chart just keeps climbing every time we look at it.
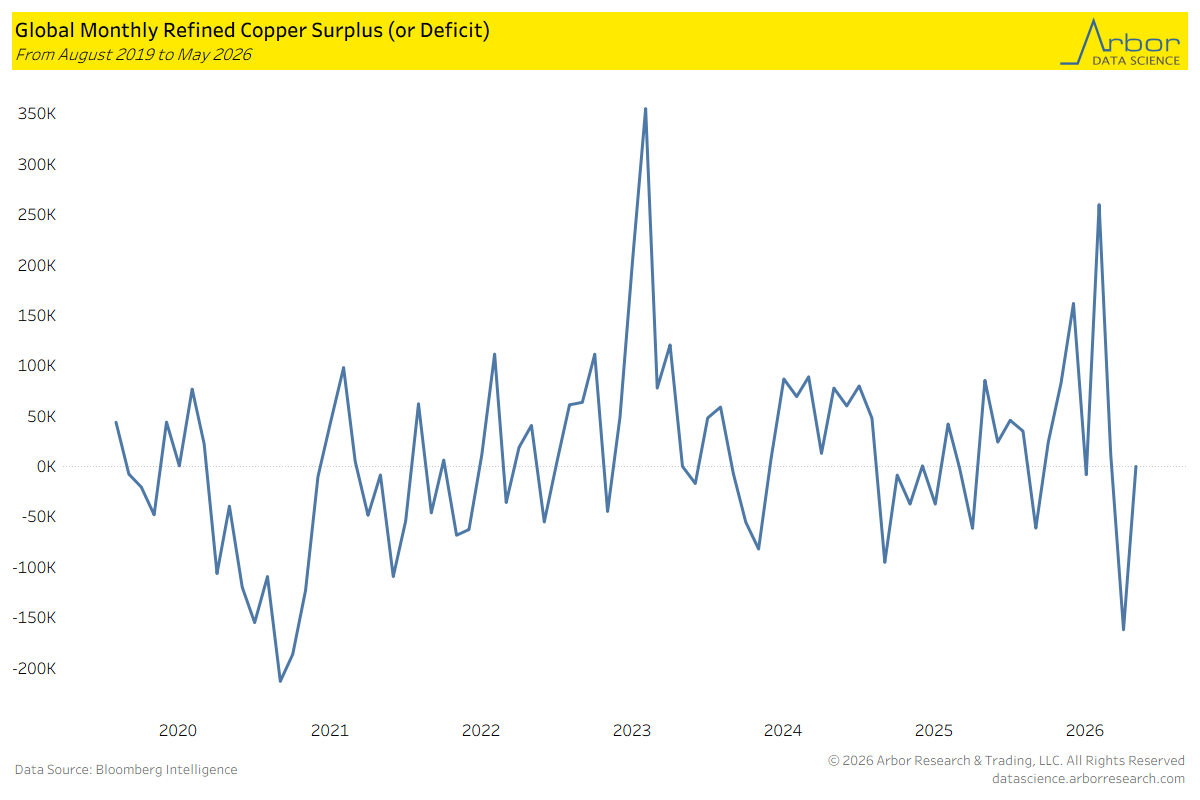
And in fact, monthly refined copper surpluses and deficits still reflect us being in a deficit, and it has been a while since we have seen any meaningful surplus.
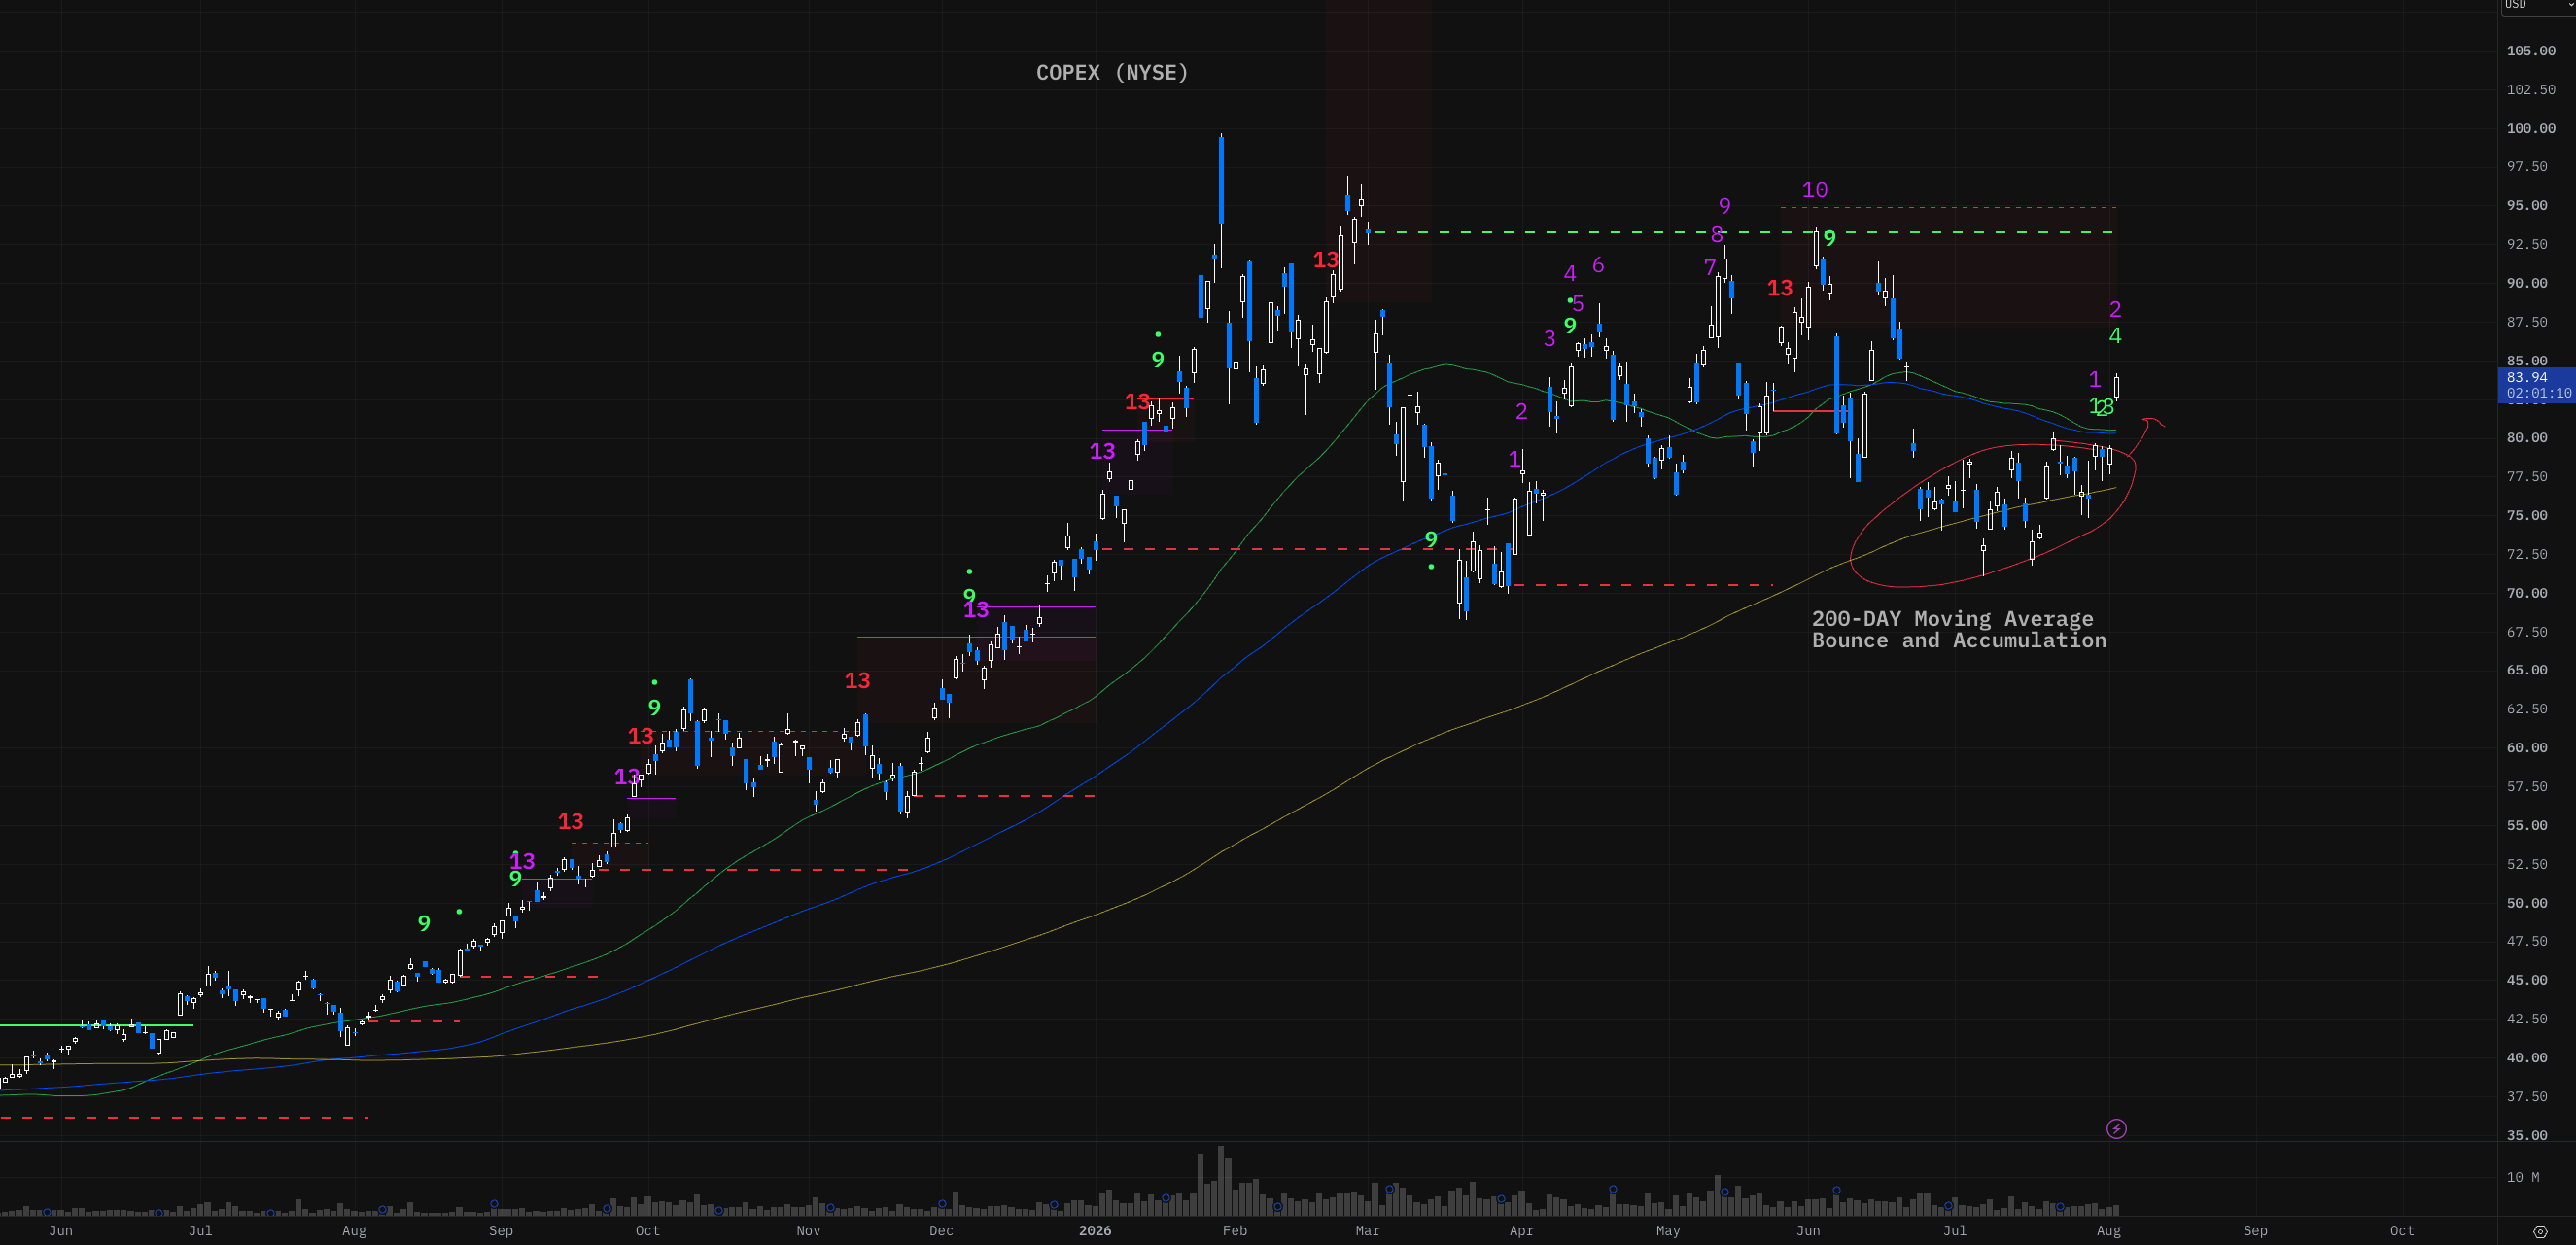
With this post, I just wanted to make it a little bit more technical than I usually do. I am going to have a bunch of charts below just to reflect what I see.
The first chart that I have is the copper stocks basing around the 200-day moving average, and then rallying pretty substantially. This chart is interesting because the ETF here is looking like it is trading at a discount to where future prices are, which are rearing towards 52-week highs.
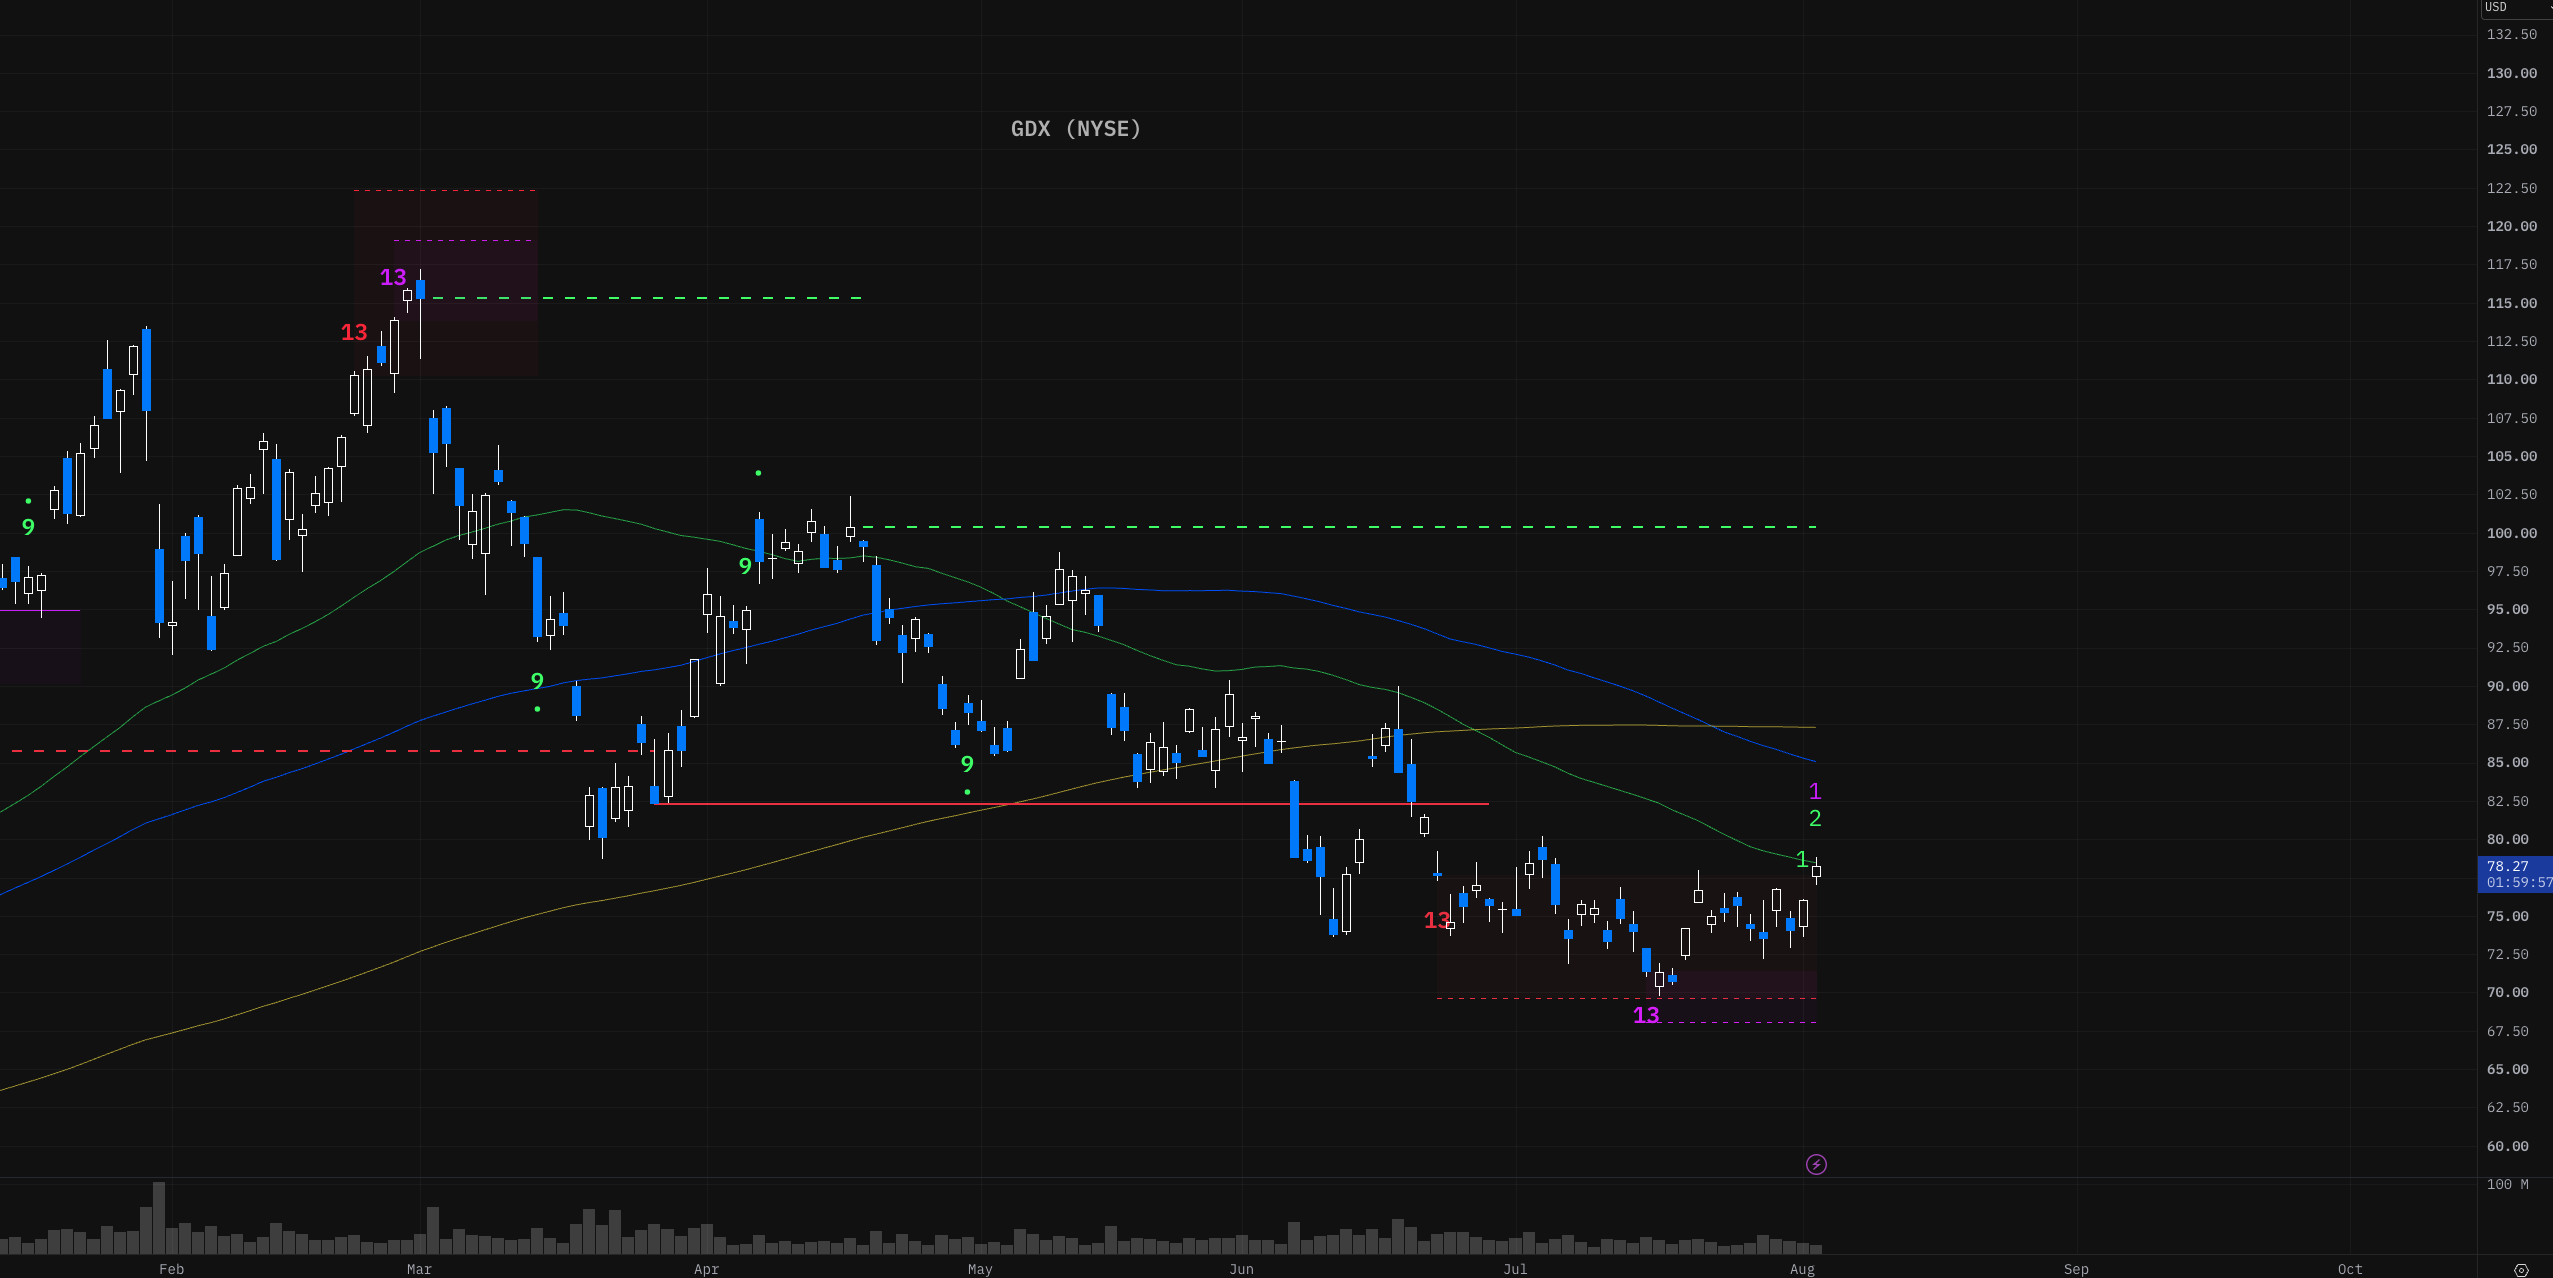
The next chart is going to be gold miners, just showing that we completed sequential 13 and combos near risk levels, and now have bounced and are flipping higher.
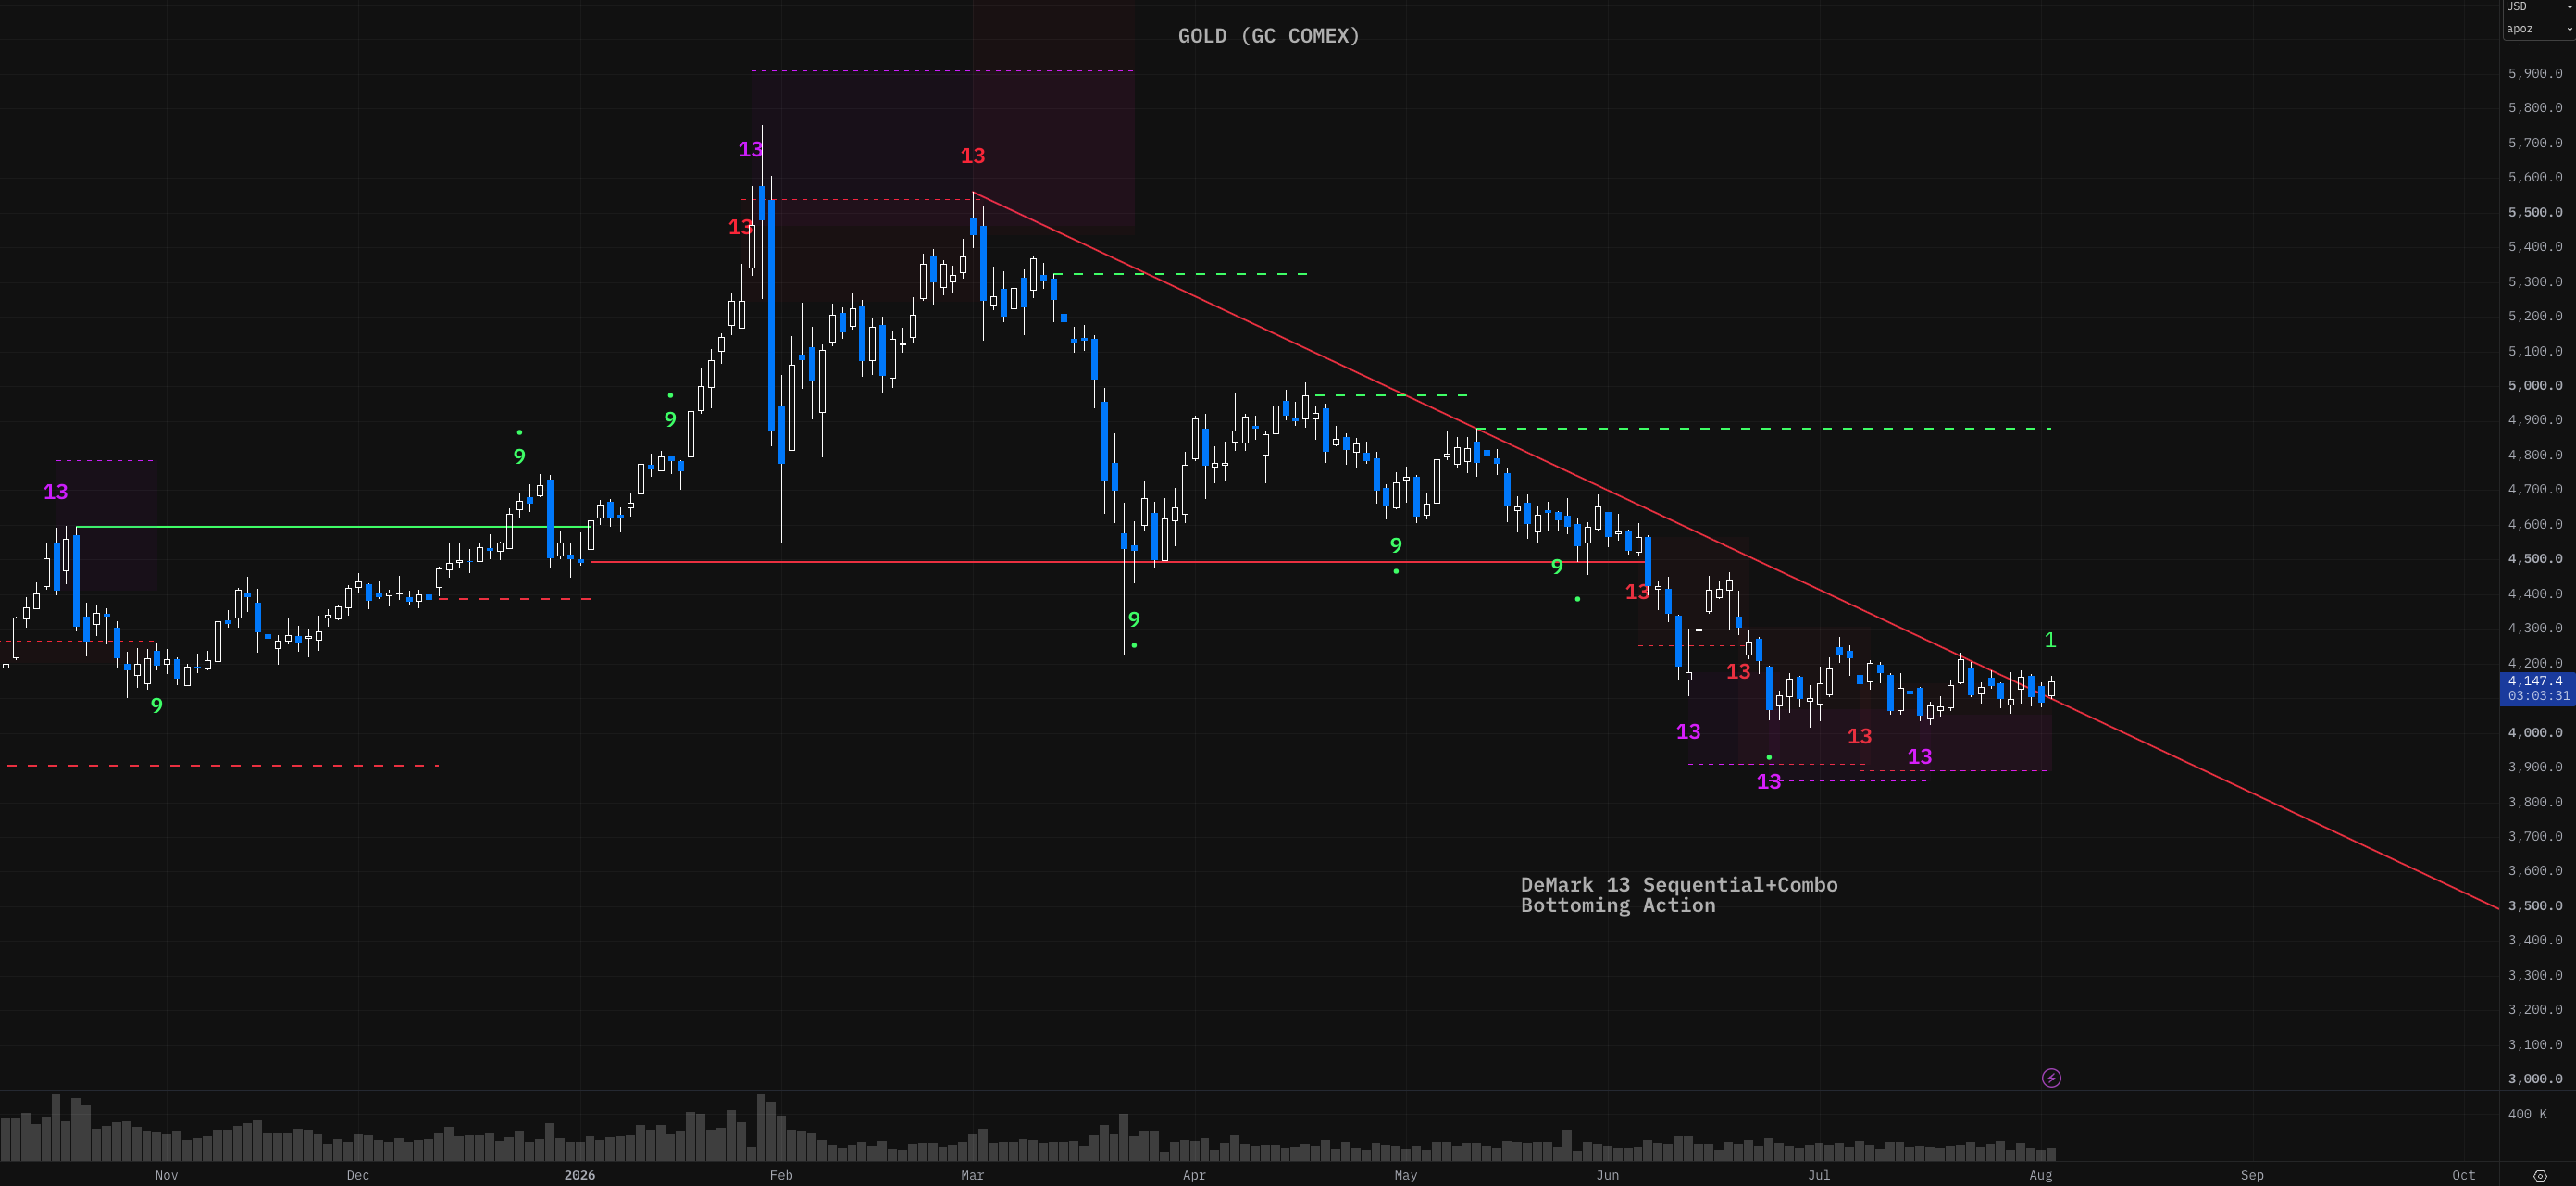
Arguably, the more important chart here is gold futures on the COMEX, which show us starting to perk above the downtrend and completing multiple sequential 13-in combos, which line up fairly well with the analog that we are tracking.
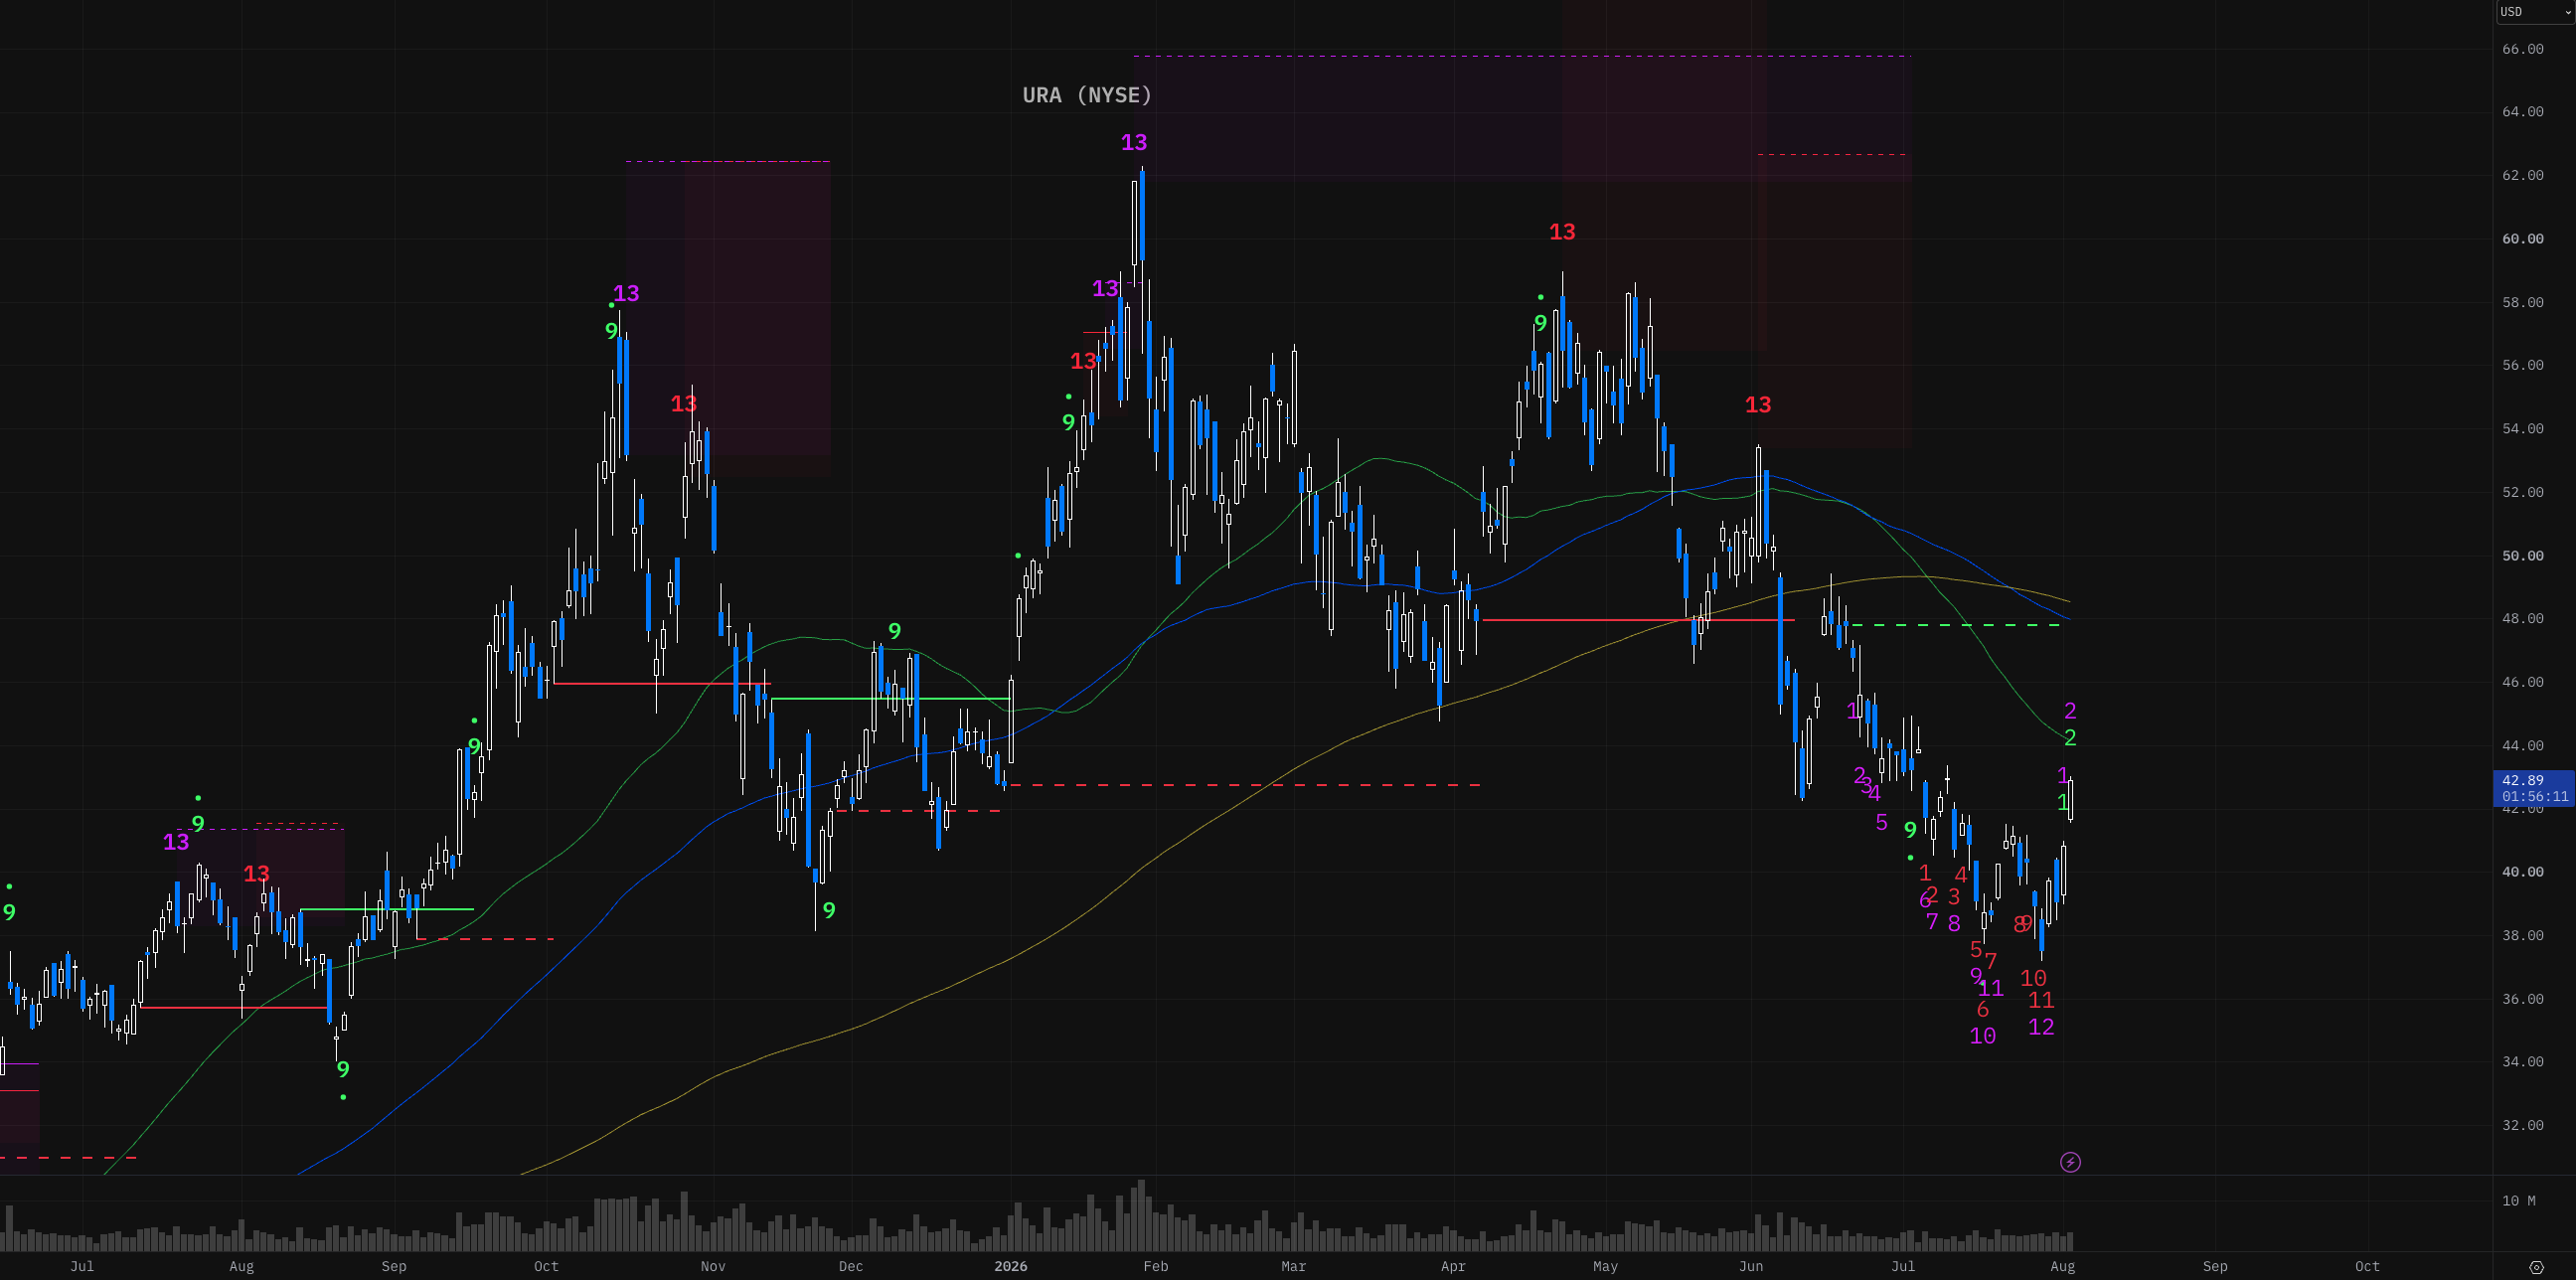
And lastly, on this whole theme of prior runners, while everyone tries to find a bottom in some of this memory stuff, I think the uranium charts also look particularly interesting, given how all these commodity charts look pretty bullish.
The TLDR is: prior commodity runners look pretty good right now, while everyone trying to make sense of what’s going on in technology. We might continue a little silent bull market that lines up well with an analog that we know has been tracking very well. Plus, the idea of being in a market where others left behind, I think, is good too.