CPI Overview
- The year-over-year change in Consumer Price Index (“CPI”) was 2.7% for July 2025, which was slightly below the expected 2.8%. For core CPI, which excludes food and energy, the year-over-year change 3.059% in July 2025, above the expected 3.0%.
- Month-over-month, CPI was 0.197% and core CPI was 0.322% for July 2025.
Breaking Down CPI and OER
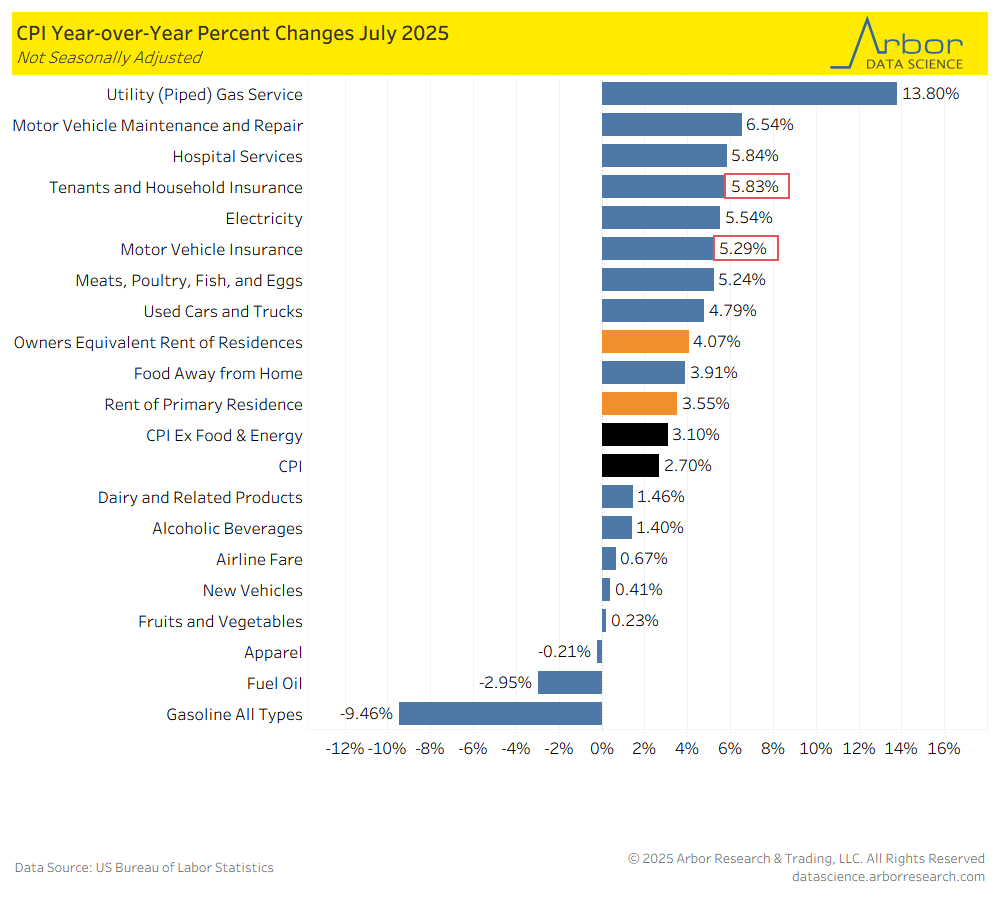
- The chart below illustrates the year-over-year changes in CPI for July 2025 by category. Utility (Piped) Gas Service had the largest increase at 13.80%, followed by Motor Vehicle Maintenance and Repair at 6.54% and Hospital Services at 5.84%.
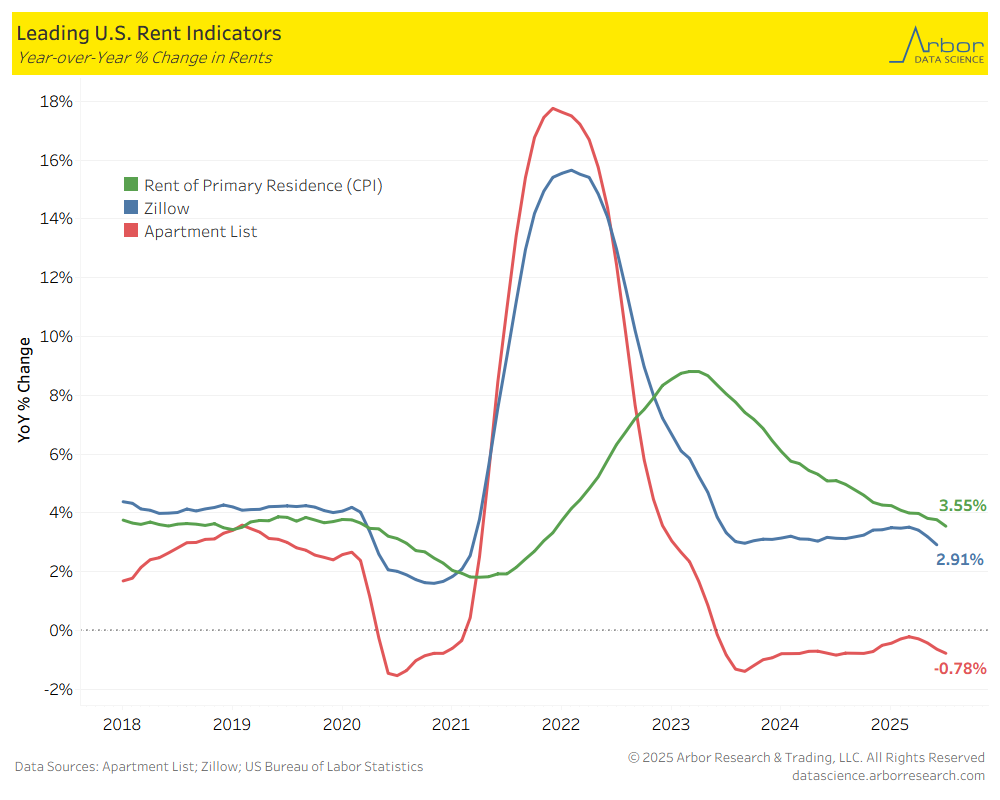
- The chart below examines the year-over-year percent change in rents based off of 3 indicators; Apartment List, Zillow and Rent of Primary Residence (CPI) from January 2018 to July 2025.
- Rent of Primary Residence was 3.55% in July 2025, Apartment List was -0.78% in July 2025 and Zillow was 2.91% in June 2025 (most recent data available).
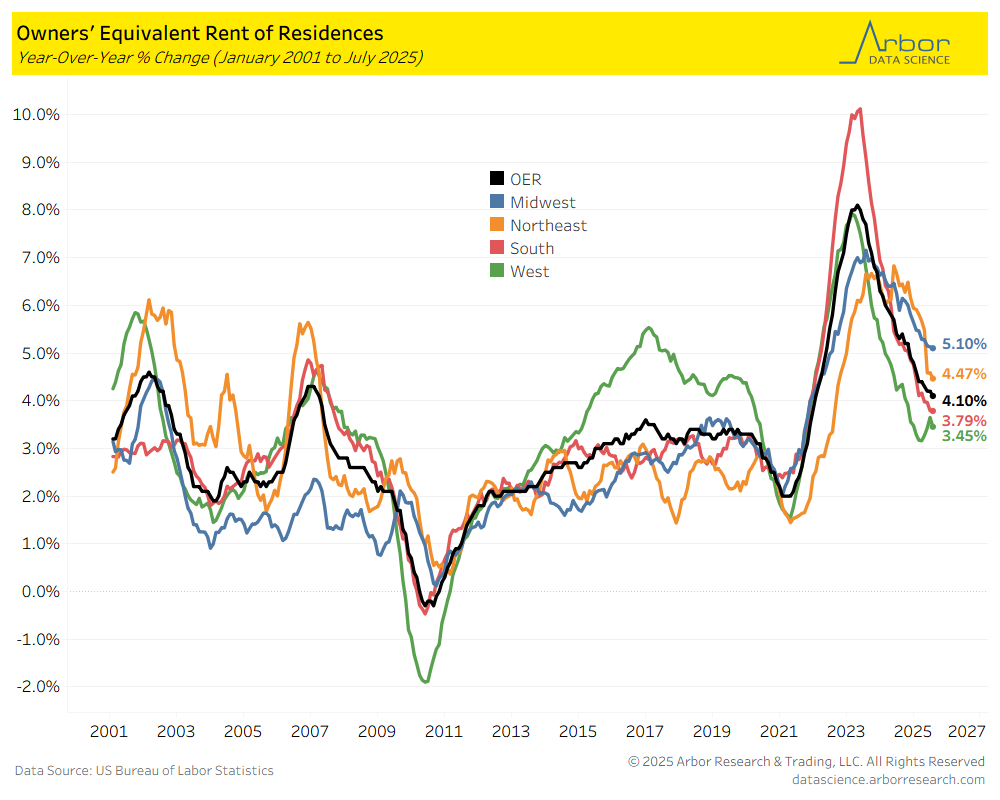
- The next chart highlights the year-over-year percent change in owners’ equivalent rent of residences by region from January 2001 to July 2025. All regions had a decline in rent in July 2025 from June 2025. OER was at 4.10% in July 2025, down from 4.20% in June 2025.
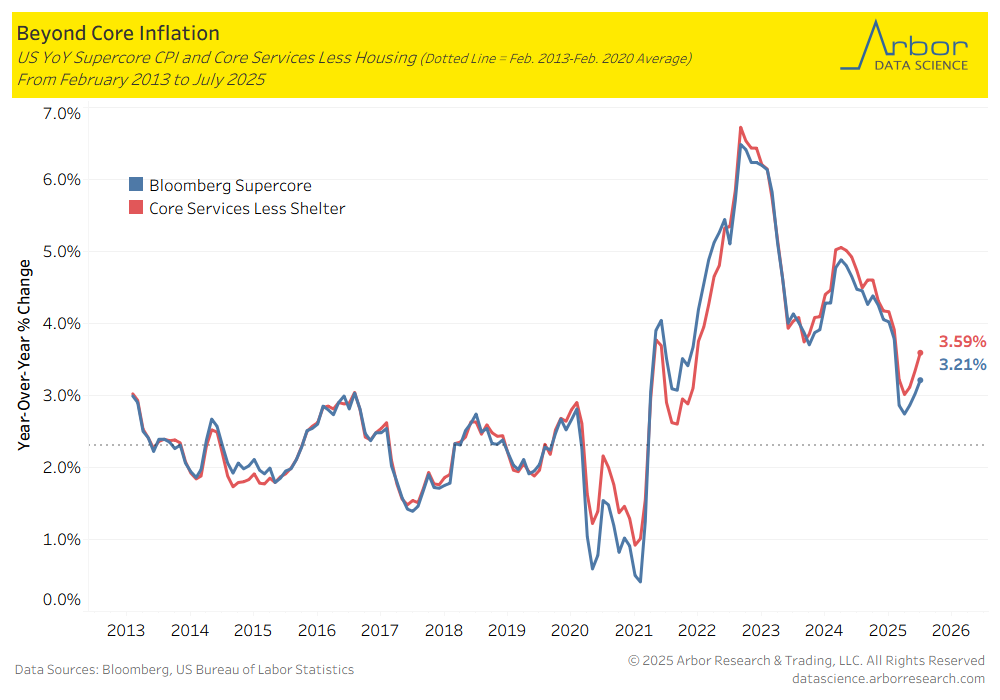
- The year-over-year Supercore CPI has trended upward from 2.7% in April 2025 to 3.21% in July 2025. Core services less shelter also trended upward from 3.0% in April 2025 to 3.59% in July 2025.
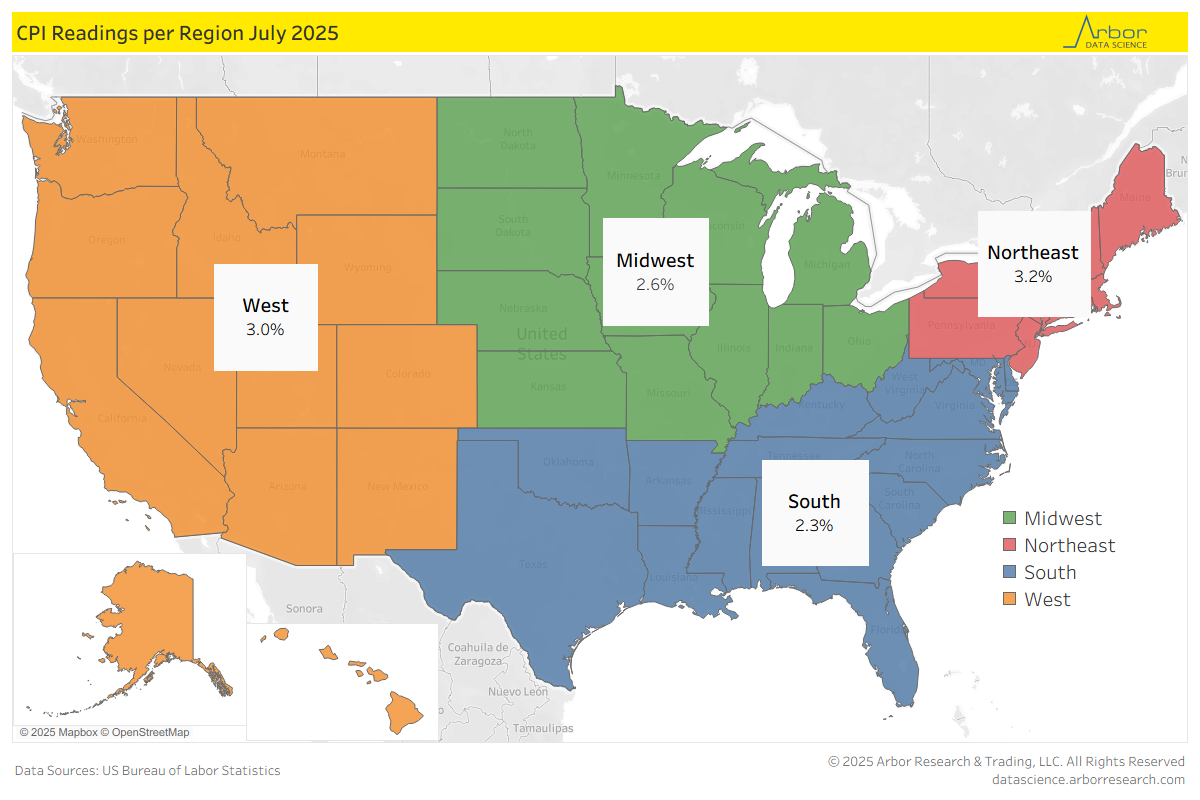
- The last chart outlines the CPI reading by region for July 2025. The Northeast had the highest CPI reading at 3.2%, followed by West at 3.0% and Midwest at 2.6%.