Personal Consumption Expenditures
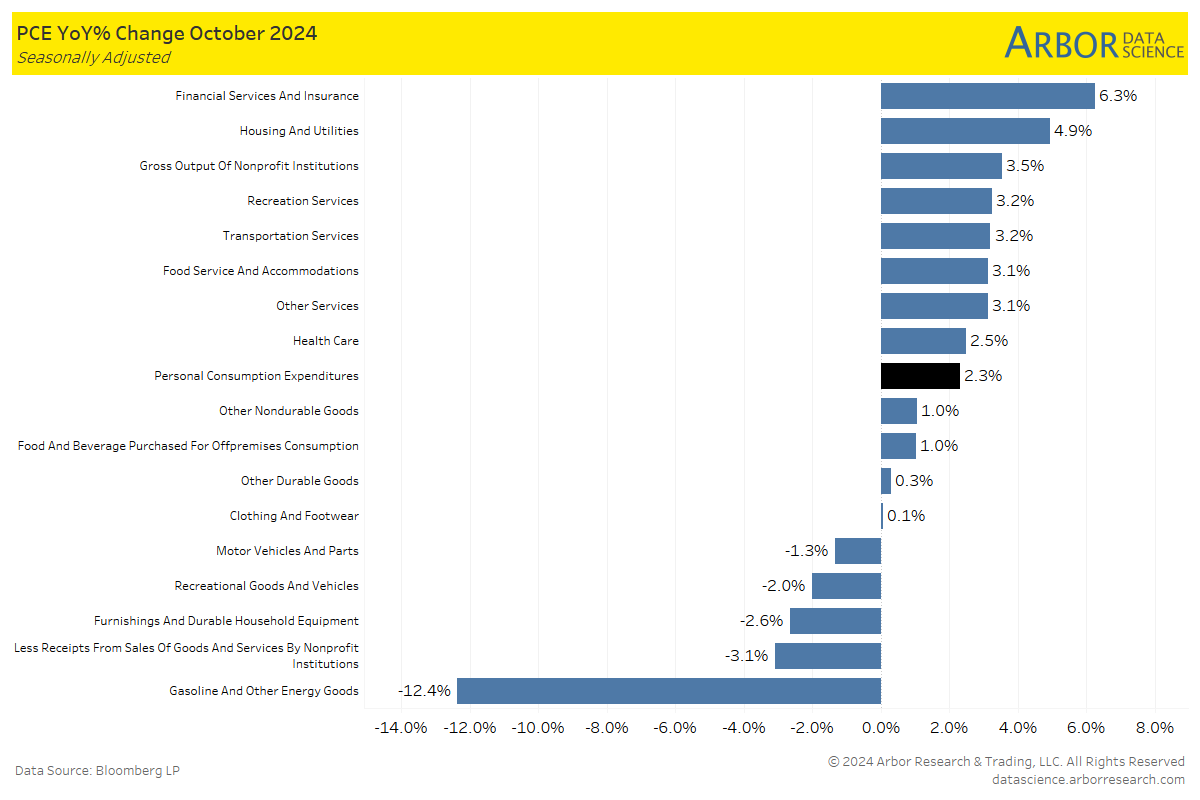
- The first chart illustrates year-over-year changes in Personal Consumption Expenditures in October 2024. The largest contributors were Financial Services & Insurance at 6.3%, followed by Housing and Utilities at 4.9%.
WalletHub’s November 2024 Economic Index
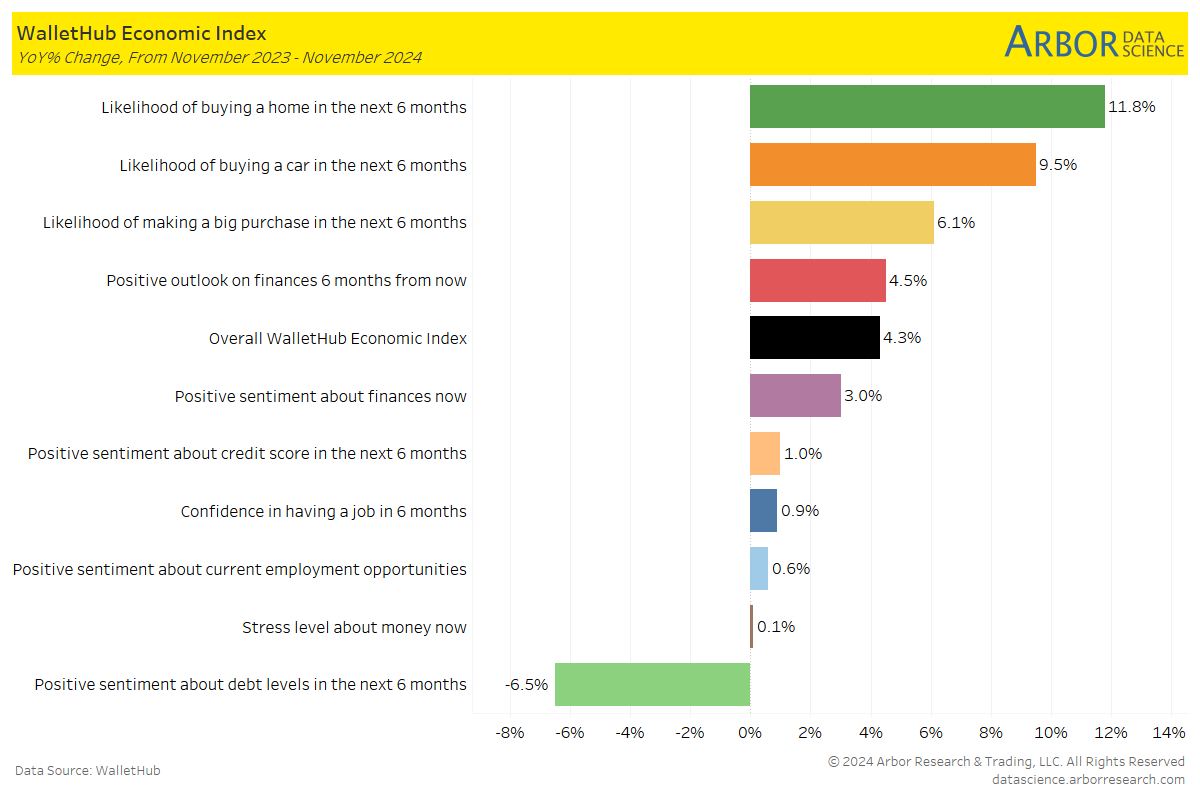
- WalletHub’s Economic Index, which is a monthly survey that measures components of consumer sentiment such as personal financing, purchasing plans and employment opportunities, increased 4.3% year-over-year (between November 2023 – November 2024). An increase indicates that consumers may be more confident about their financial outlook than they were at the same time last year.
- The largest year-over-year percentage changes were in the categories of: “Likelihood of buying a home in the next 6 months” at 11.8% and the “Likelihood of buying a car in the next 6 months” at 9.5%.
- The largest decline was in the category: “Positive sentiment about current employment opportunities,” which declined -6.5% year-over-year.
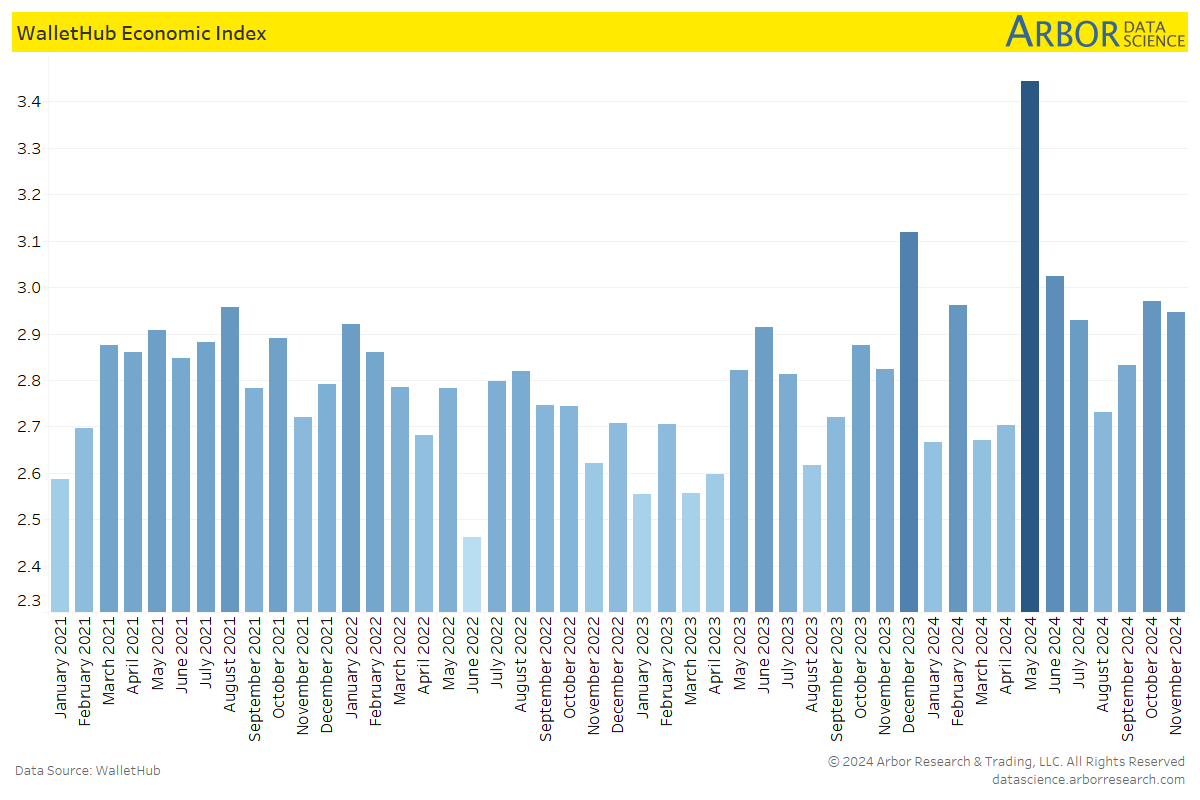
- The following chart illustrates the monthly change in WalletHub Economic Index by month from January 2021 to November 2024. After peaking at 3.45% in May 2024, the index was 2.95% in November 2024.
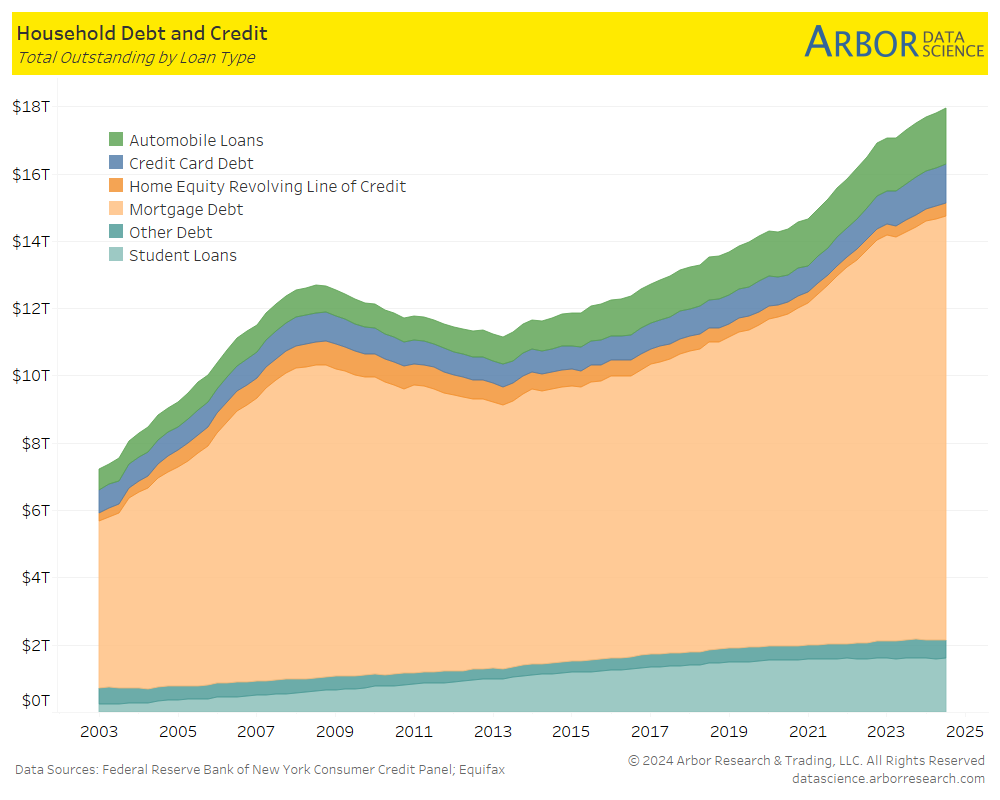
- According to the Federal Reserve Bank of New York’s quarterly report for Q3 2024, total outstanding U.S. household debt increased $140 billion from $17.80 trillion in Q2 2024 to $17.94 trillion in Q3 2024. Total Credit Card debt in Q3 2024 climbed to $1.61 trillion.
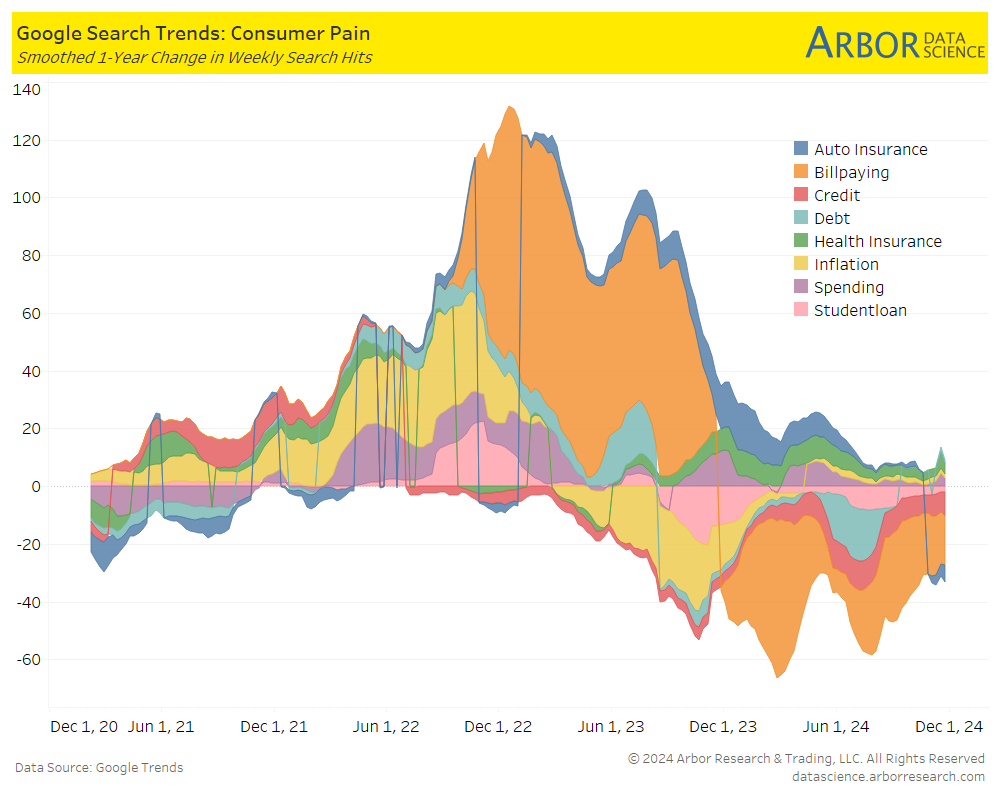
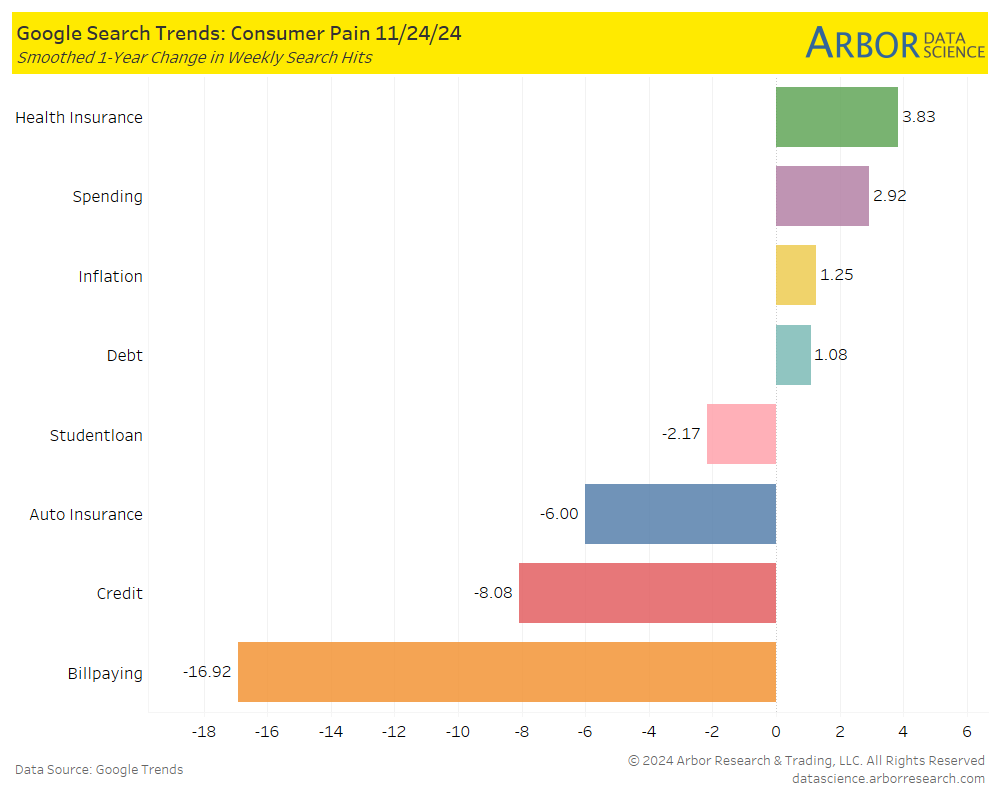
- We utilize Google Search Trends to gain insight on search interest for consumer expenditures. Health Insurance, Spending, Inflation, Debt and Auto Insurance had positive search interest through November 24, 2024.


