One Key Theme: A Rush to Muni Bonds
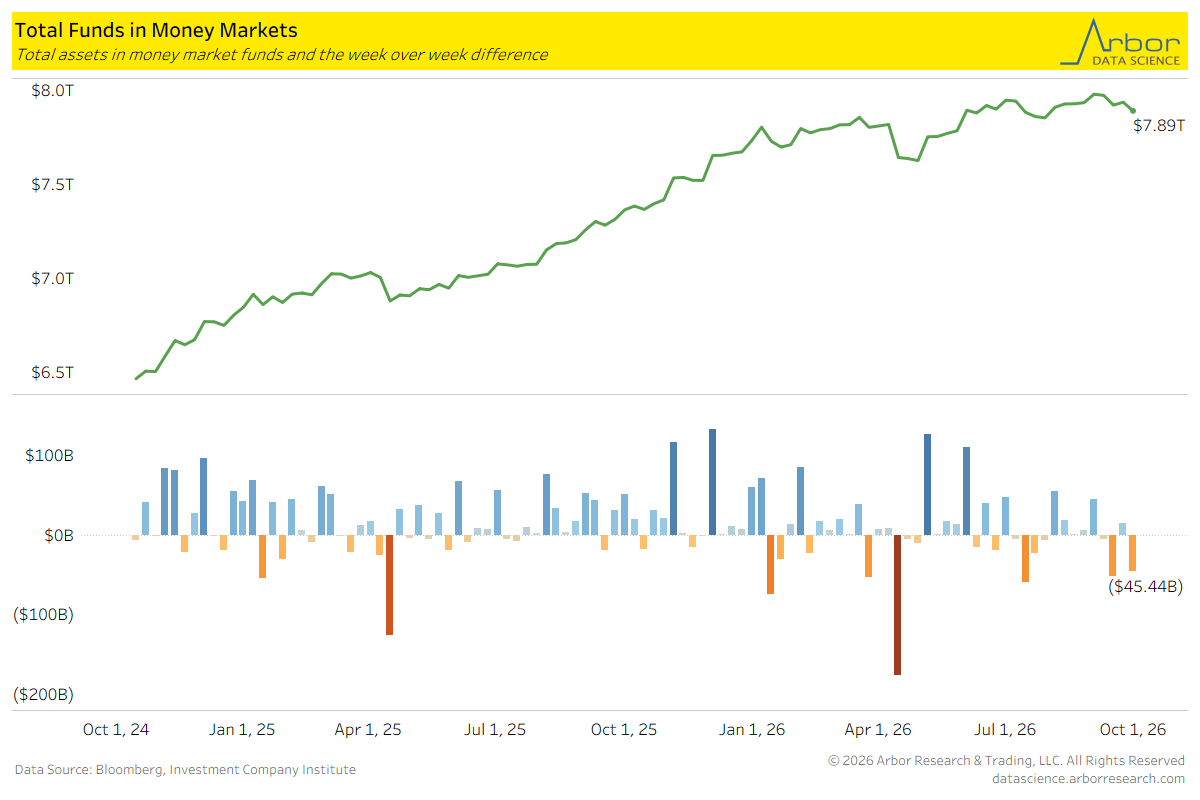
- As of 10/5/2026, the tax-equivalent yield (TEY) on AAA-rated municipal bonds was over 8%. The TEY on 30-year AAA munis rose from 7.97% on 9/4/2026 to 8.75% on 10/5/2026, an increase of 78 bps.
- For comparison, the yield on the 30-year Treasury bond increased by 45 bps over this same period, and was at 5.69% on 10/5/2026.
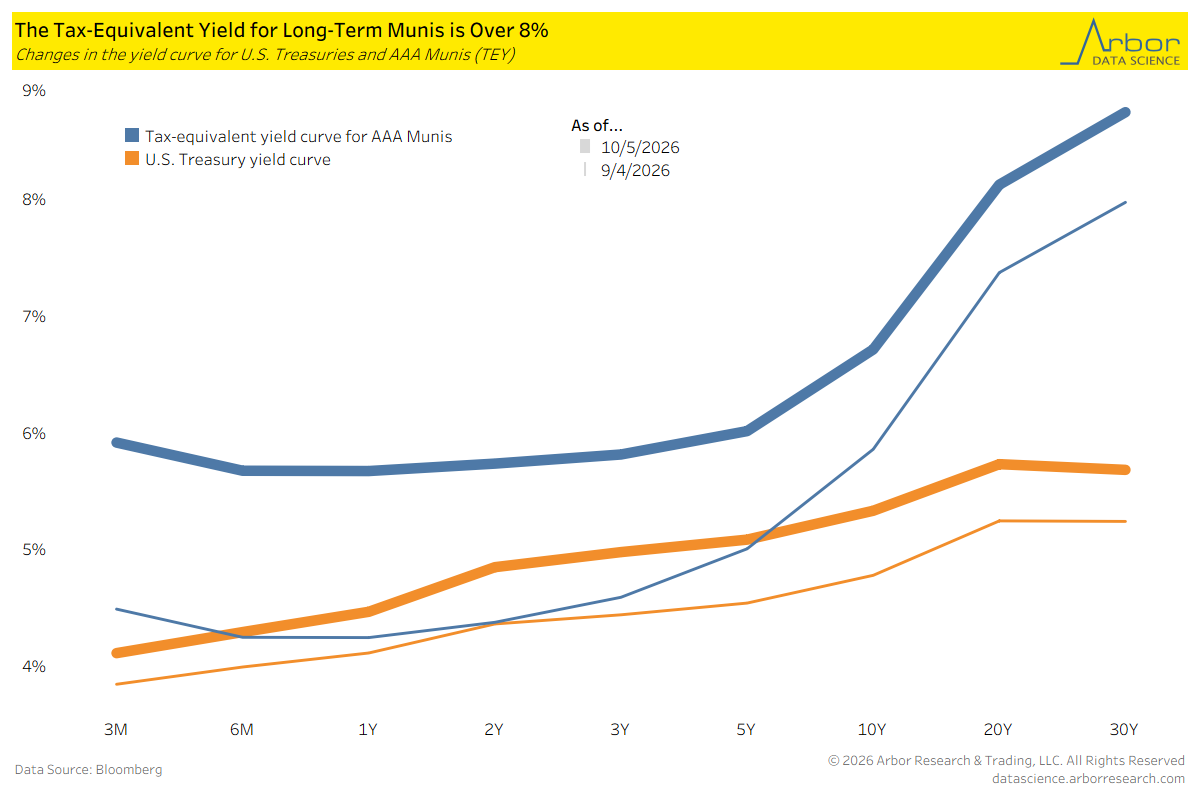
- The one-month rolling flows into municipal-bond ETFs was $14.97 billion through 10/2/2026. This was the highest level of inflows into these ETFs since 2020, and prior to September 2026, one-month rolling flows were never greater than $8 billion.
Flows for the Prior Week
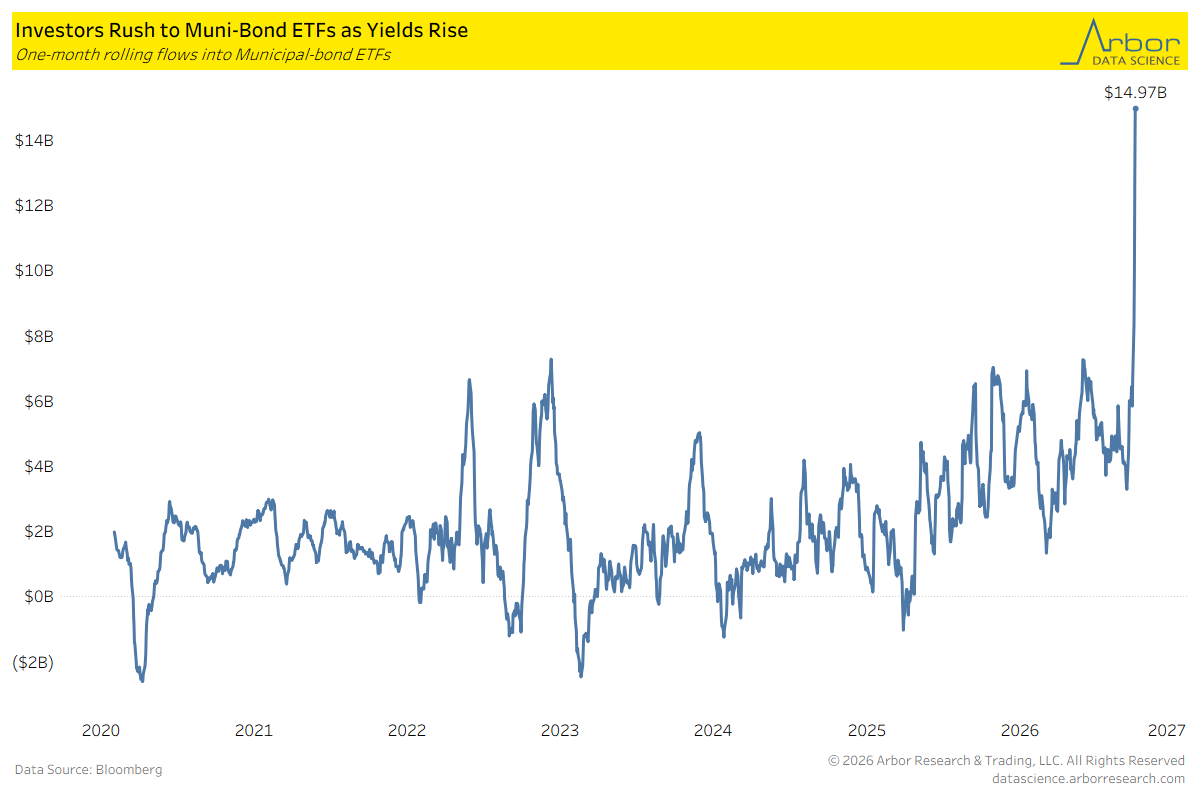
- In the prior week (9/28/2026 to 10/2/2026), 16 of our 20 ETF categories had positive inflows.
- ETFs focused on Government bonds had inflows of $13.68 billion, which was the most of any fixed-income category.
- U.S. Large-cap ETFs had inflows of $13.80 billion, which led the equity group.
- The category with the largest outflows was Cyclical Sectors, with outflows of $5.99 billion.
The Share of ETFs With Postive Flows
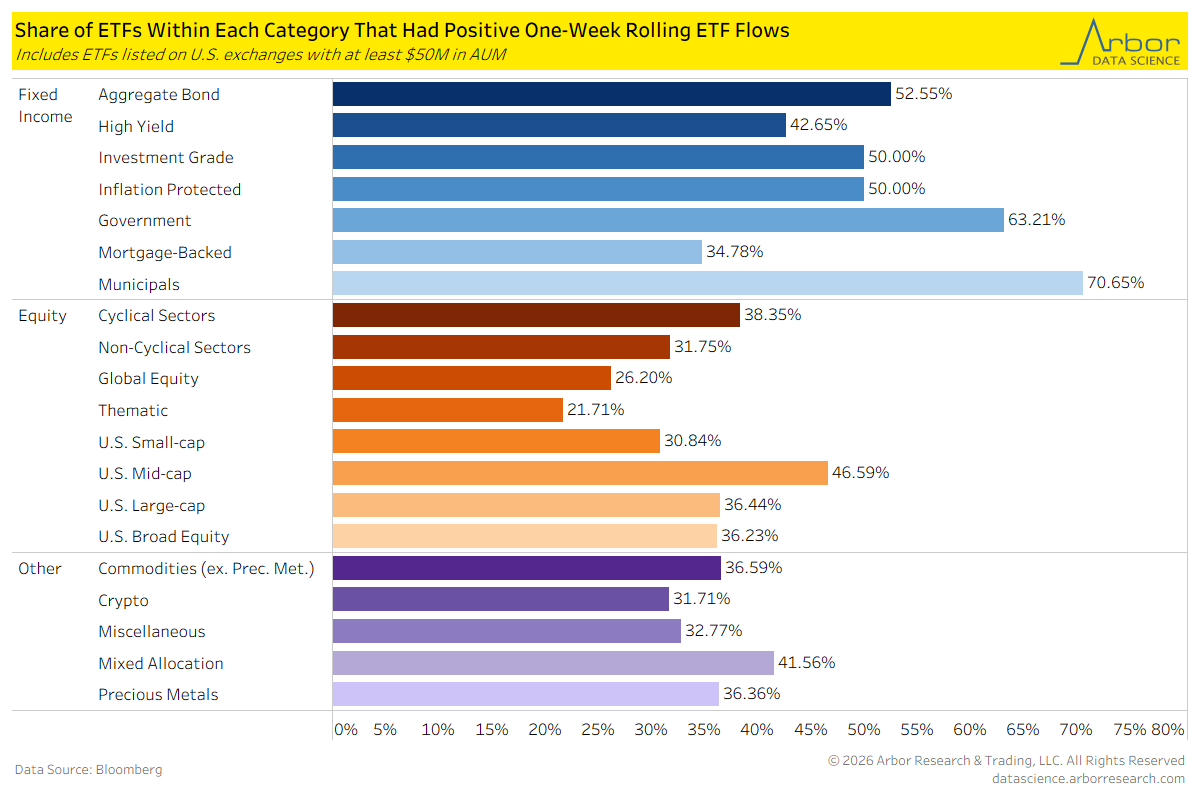
- The chart below illustrates the share of ETFs within each group that had inflows in the prior week. Overall, only five of the 20 categories had at least 50% of ETFs that received inflows.
- The Municipals category had the highest share of ETFs with inflows, with 70.65%.
- There was no category that focused on equities or alternatives that had at least 50% of listed ETFs with inflows.
A Standardized Comparison of Flows
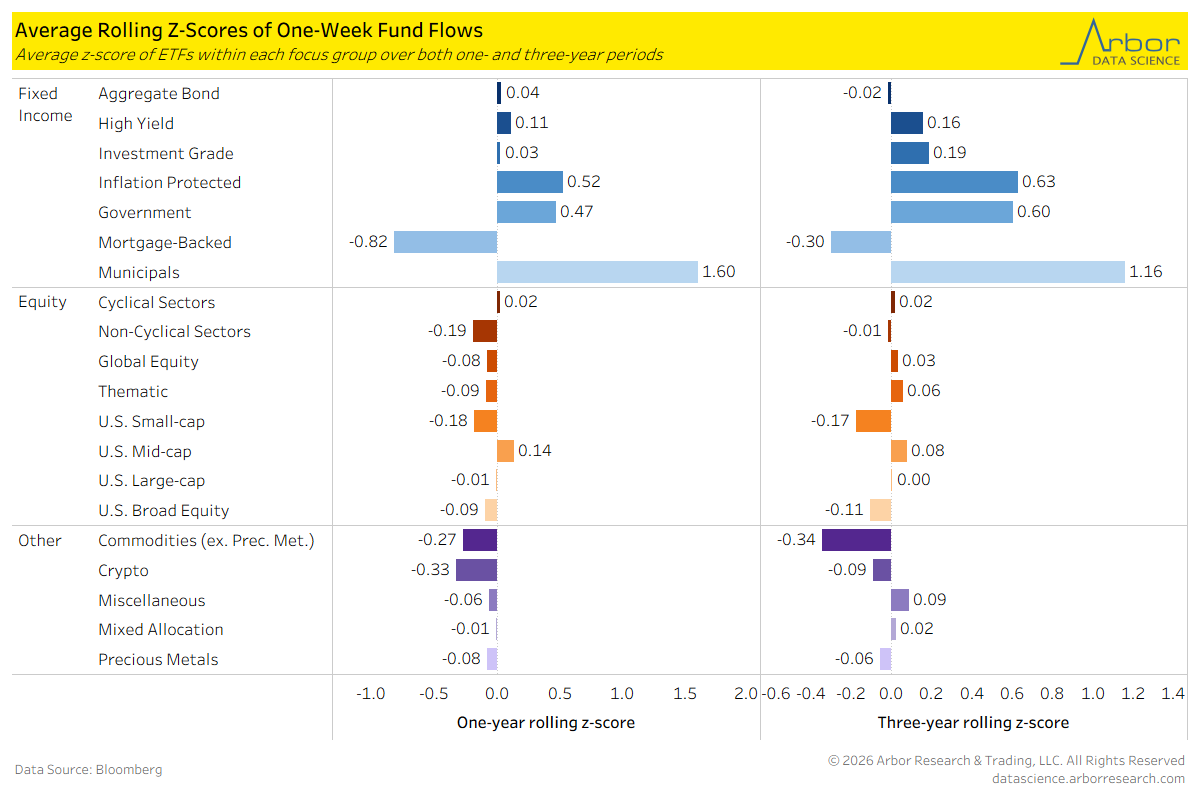
- The following chart uses the one-week rolling flows to depict the average of the one- and three-year rolling z-scores for ETFs within each group.
- Flows into ETFs that invest in municipals were very strong relative to both the one- and three-year periods, with an average z-score of 1.60 and 1.16, respectively.
- Relative to the one-year period, flows were weakest in Mortgage-Backed ETFs, with an average z-score of -0.82.
- The category with the lowest flows relative to the three-year period was Commodities (excluding precious metals), which had an average z-score of -0.34.
Year-to-Date Flows
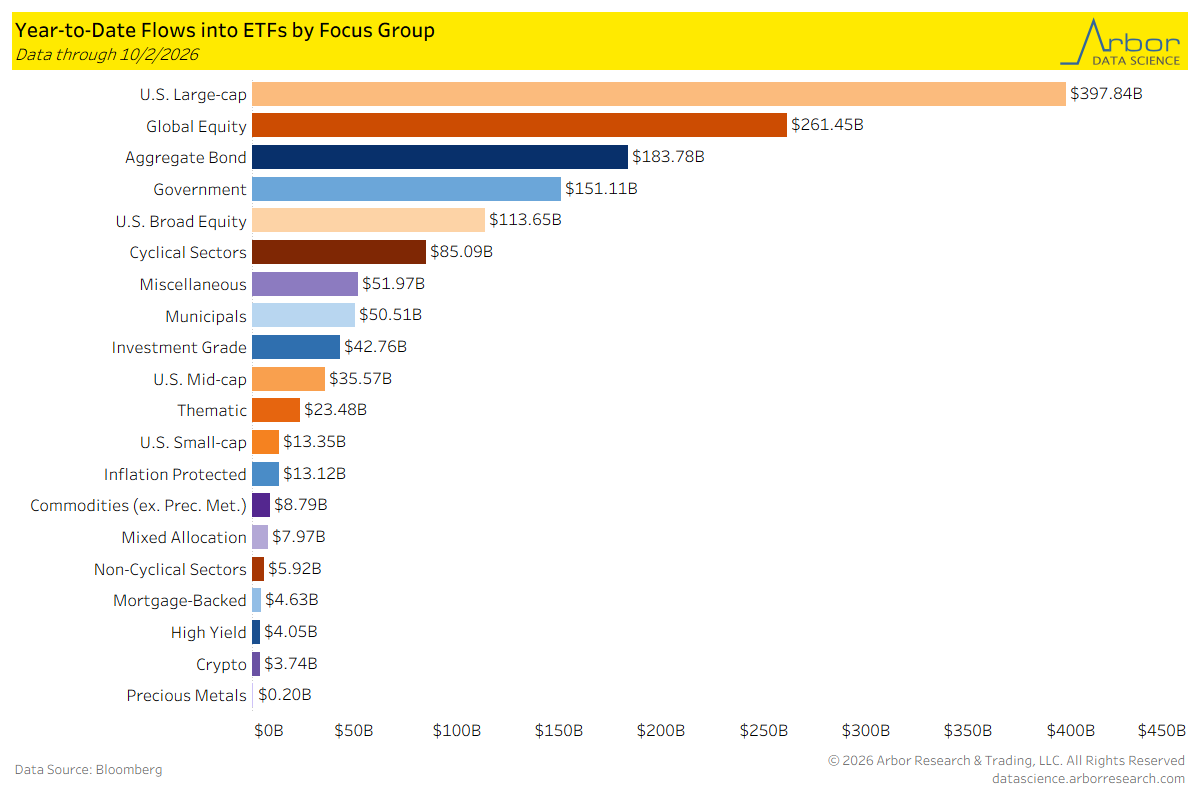
- Through 10/2/2026, U.S. Large-cap ETFs had year-to-date inflows of $397.84 billion, which was by far the most of any category.
- Aggregate Bond ETFs had year-to-date inflows of $183.76 billion, the most of any fixed-income category.
- Precious Metal ETFs had the lowest inflows of any category, at $0.20 billion.
Flows into Government-Bond ETFs by Maturity Focus
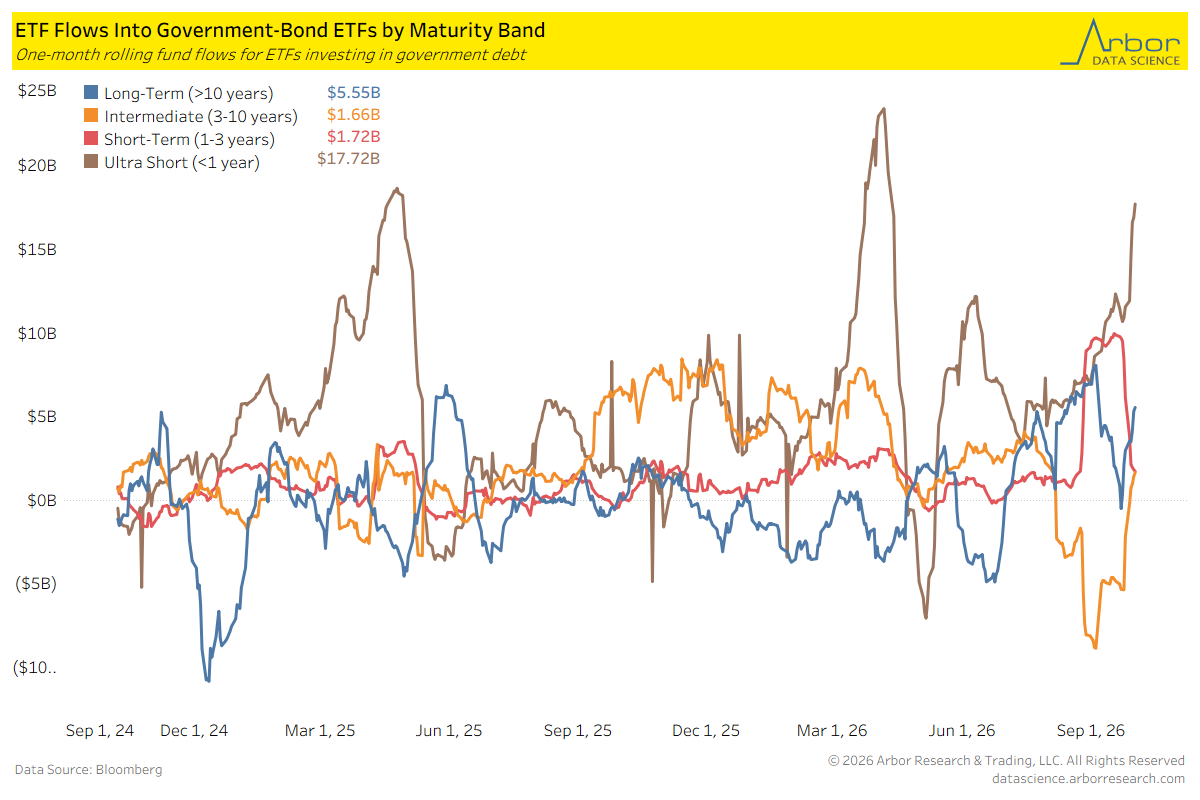
- The one-month rolling fund flows into ultra-short Government ETFs was $17.72 billion. This was its highest level of flows since April 2026.
- The one-month rolling flow into long-term Government ETFs was $5.55 billion.
Flows into IG and HY Corporate ETFs
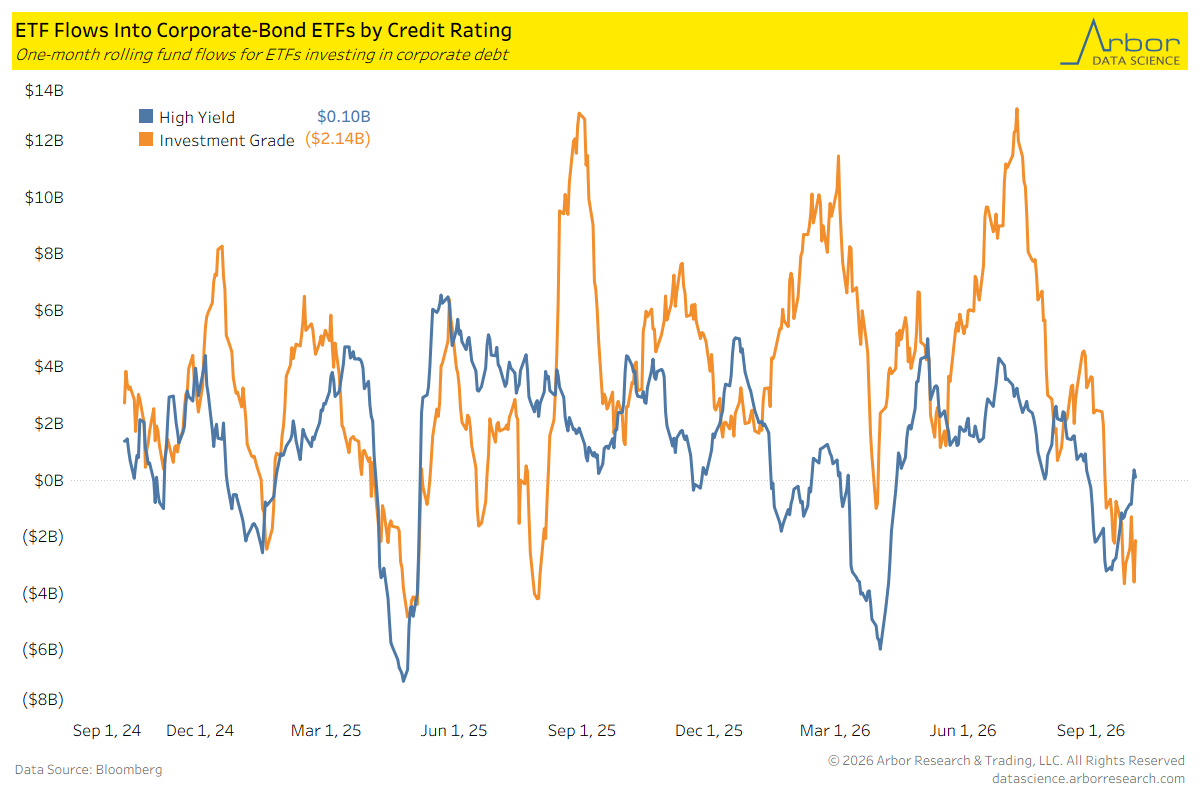
- ETFs that focused on investment-grade corporate debt had one-month rolling outflows of $2.14 billion, while ETFs investing in high-yield corporate debt had inflows of $0.10 billion.
Quarterly Flows into Different Types of U.S. Equities
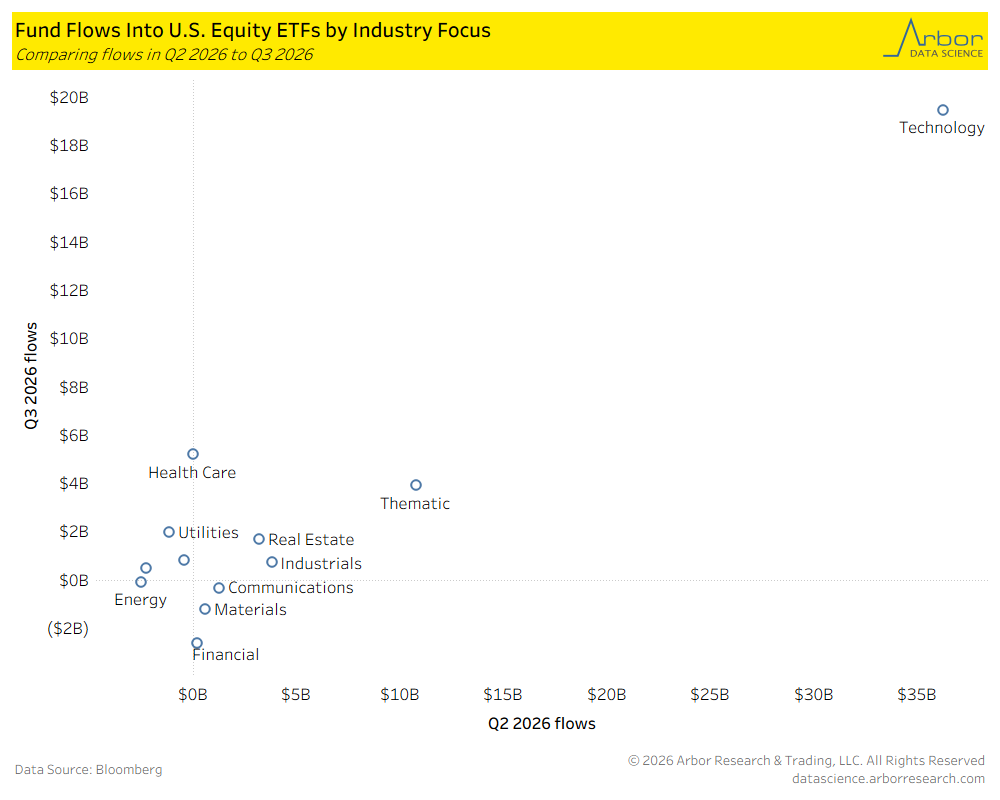
- In both Q2 2026 and Q3 2026, ETFs that focused on U.S. Technology stocks had much larger inflows than any other industry. Tech-sector ETFs had inflows of approximately $35 billion in Q2 and $20 billion in Q3.
- The next-closest group for Q2 flows was thematic, at $11 billion.
- For Q3 flows, healthcare ETFs had the second-most inflows, at $5 billion.
An Eye on the Use of Leverage
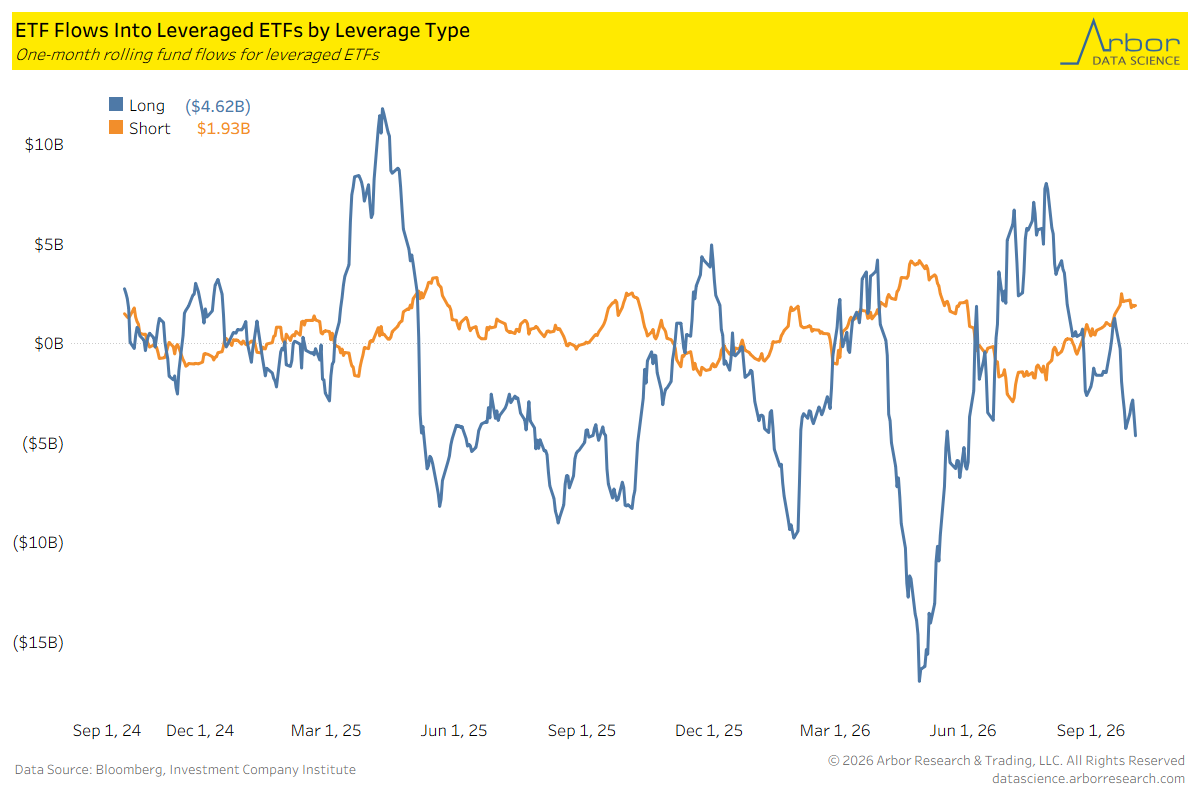
- Long-leveraged ETFs had one-month rolling outflows of $4.62 billion, while short-leveraged ETFs had inflows of $1.93 billion.
Total Money Market Assets
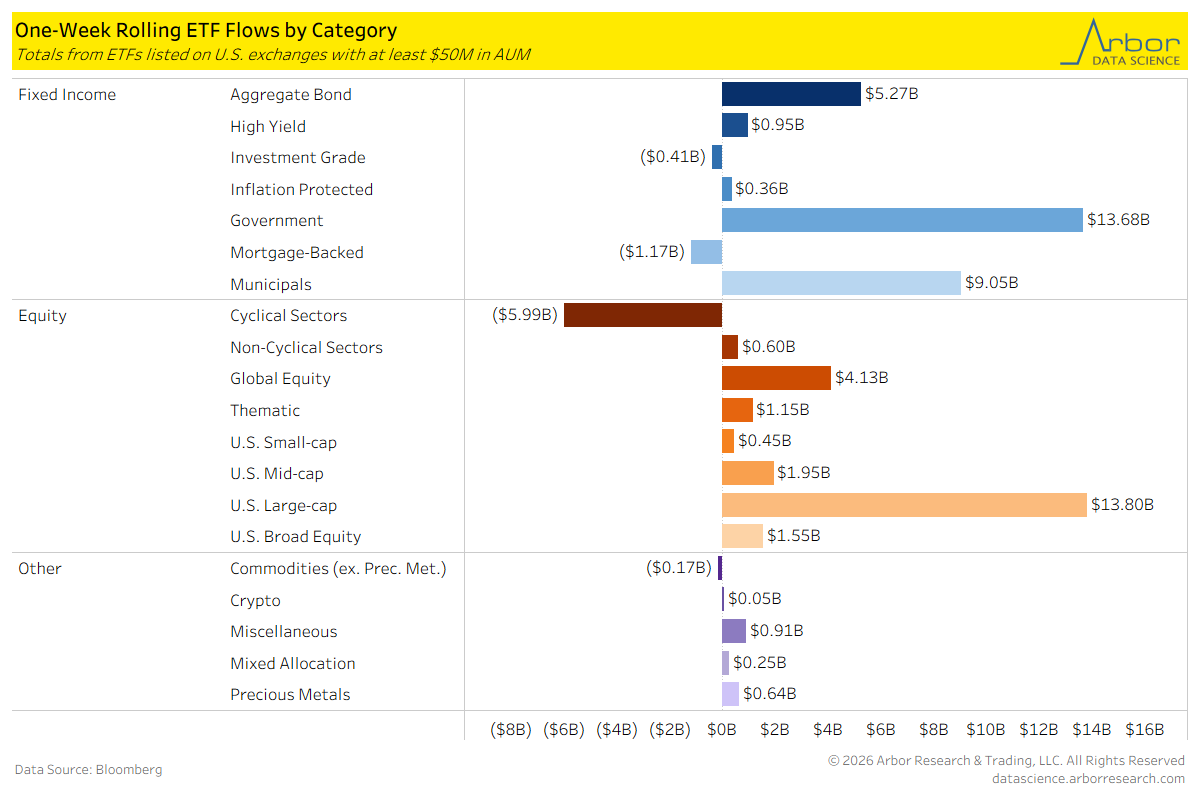
- On 9/30/2026, the total assets in money market funds decreased by $45.44 billion from the prior week. The total level of assets was $7.89 trillion.