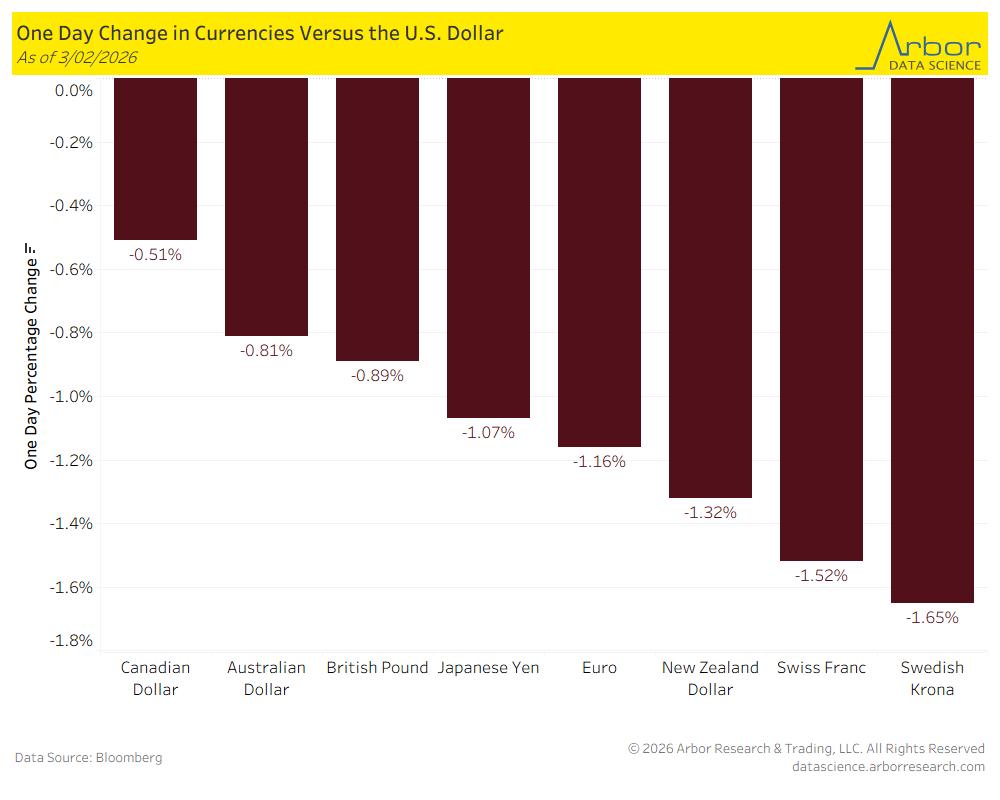
The dollar is bouncing robustly this week. U.S. and Israel struck Iran over the weekend, killing Khamenei and triggering a regional war. The Strait of Hormuz is effectively shut—tanker traffic down 80%+, at least five vessels damaged, and Iran’s Revolutionary Guard declared it closed. Oil ripped 8-9% on Monday. WTI pushed past $72, Brent briefly touched $82 before settling in the high $70s. The dollar surged on the back of it—safe-haven bid met inflation re-pricing. Markets are now pulling back rate cut expectations as the Fed deals with oil-driven price pressures stacking on top of already-sticky producer prices.
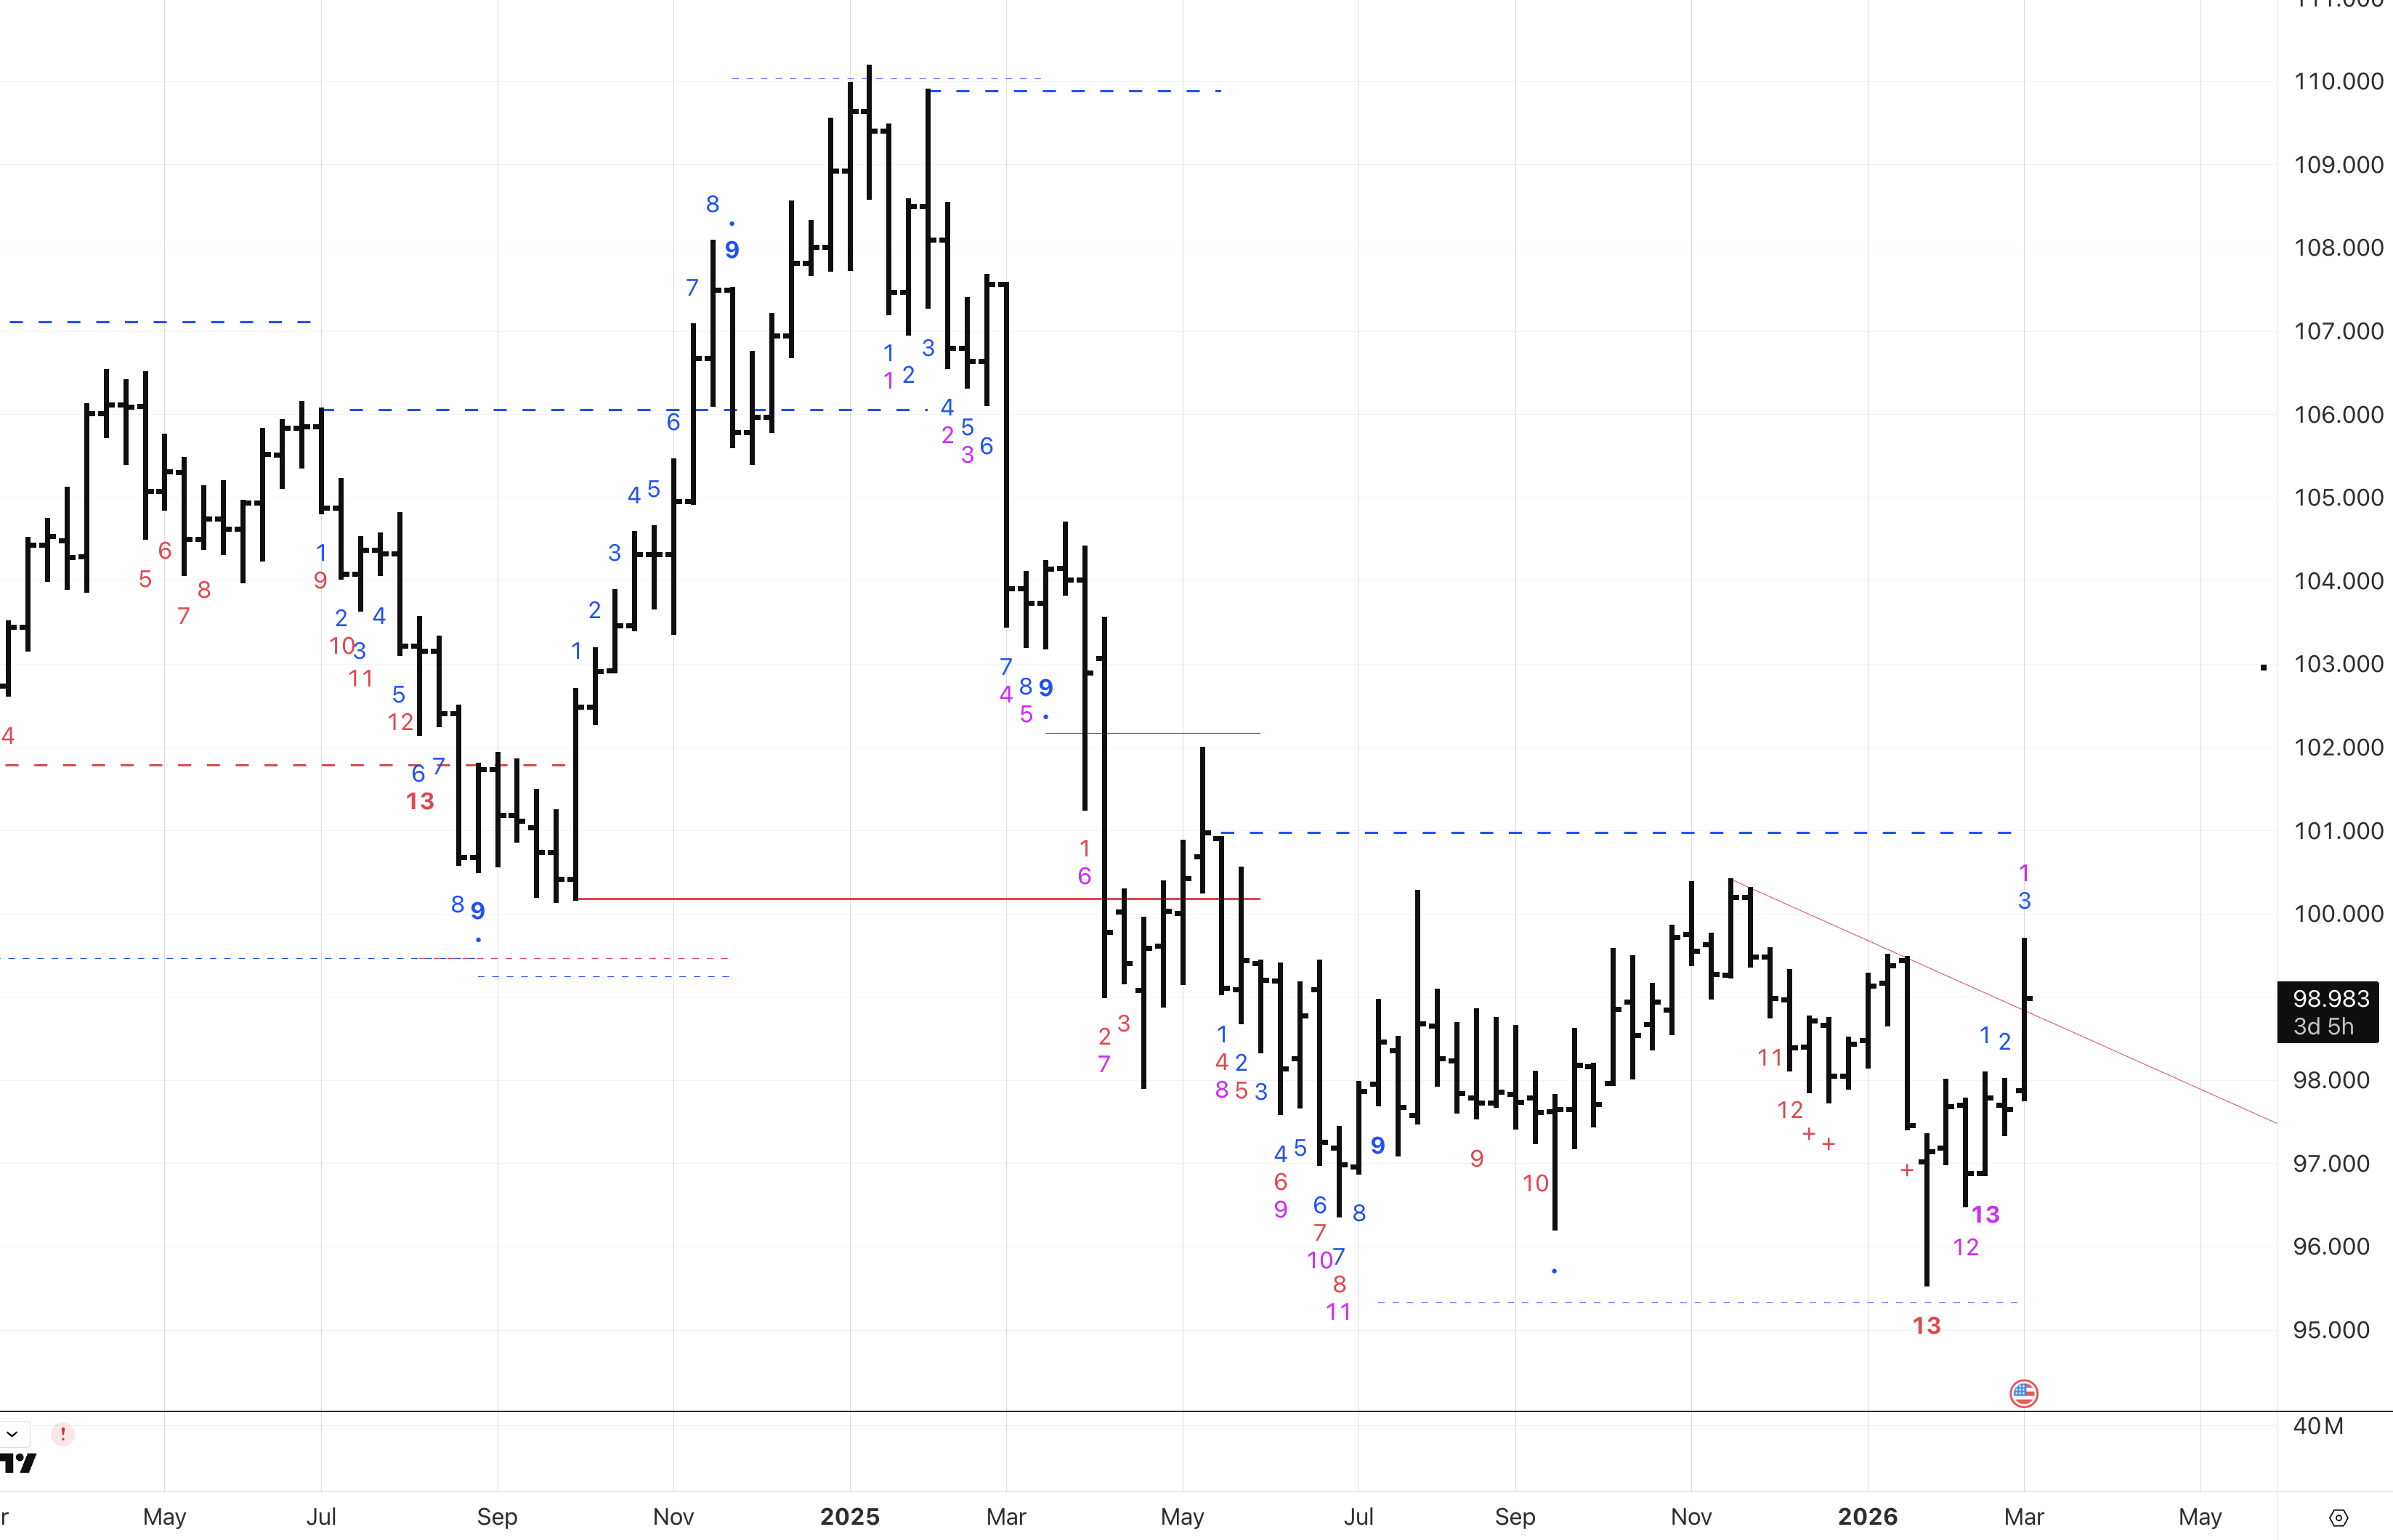
This is a countertrend move within a larger secular decline. The structural case for a weaker dollar hasn’t changed. DXY peaked near 108 in early 2025 and has bled roughly 10% since. Iran just handed the market a catalyst for a short-term reversal. This is after we flagged the weekly DeMark charts last time as setting up for a countertrend rally.
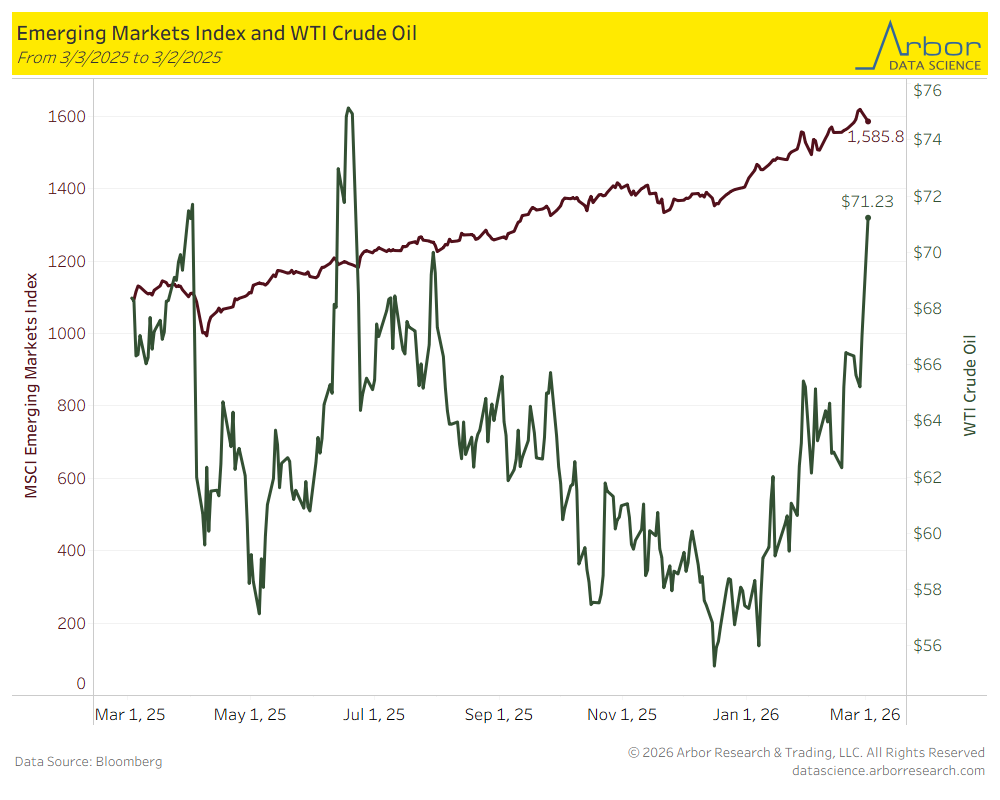
The Iran escalation complicates the dollar-EM relationship. Oil surging is a double-edged sword for EM. Commodity exporters benefit, but the majority of the EM index is Asian tech—China, Taiwan, Korea, India—and those economies are net energy importers. Higher oil means wider current account deficits, imported inflation, and central banks that can’t cut as aggressively. The index had just cleared its 2021 highs with the broadest participation in years. Whether this rally absorbs a sustained oil shock is the question. If Hormuz stays closed for weeks and Brent pushes past $90, the EM trade gets harder to hold.
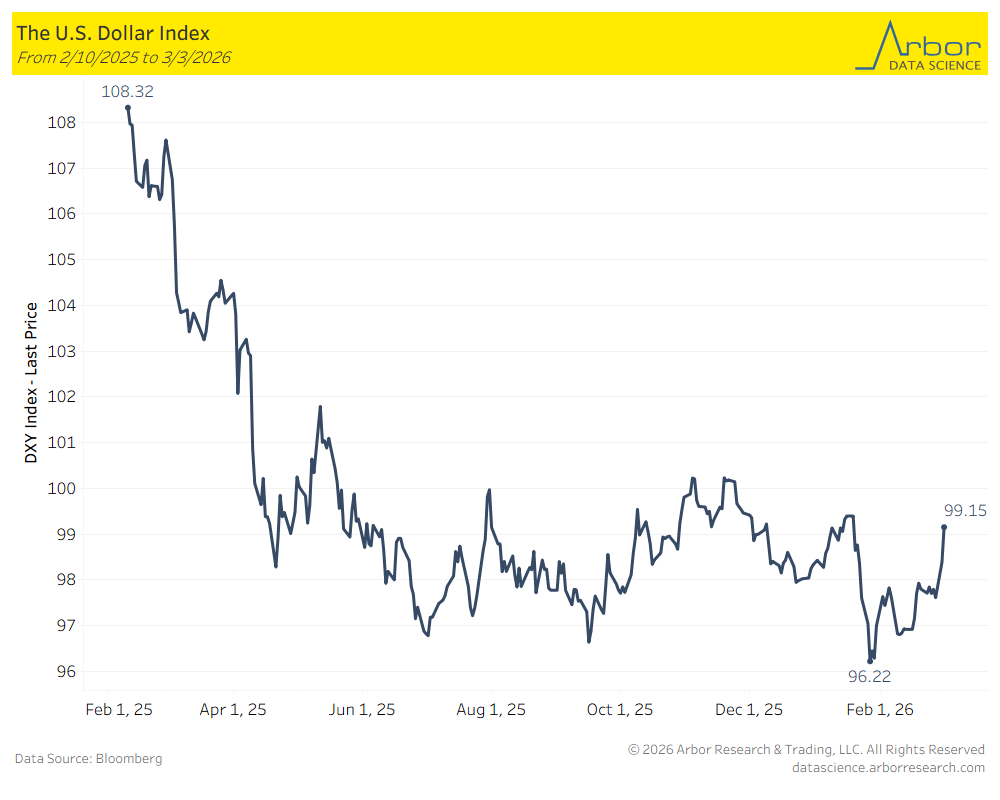
The bigger picture. DXY peaked at 108.32 in early 2025 and has been in a secular downtrend for over a year—down roughly 12% to a low of 96.22 a couple weeks ago. That was the lowest since February 2022. The drivers: Fed rate cuts narrowing the yield advantage, the “sell America” trade, the capital rotation into European equities and EM, and a Trump administration openly comfortable with a weaker dollar to rebalance trade.
But here’s what the panic is missing: global oil production is essentially at all-time highs. The world was already oversupplied coming into this. China had been stockpiling crude both onshore and floating offshore for months. OPEC+ just announced another 206,000 barrel/day output increase. Iran produces roughly 3.5 million barrels/day of crude—about 4% of global supply—and exports around 1.7 million, most of which goes to China under sanctions anyway. If Iranian production collapses from internal unrest, labor strikes, and a leadership vacuum, you are removing barrels that were already largely discounted by the market. The supply cushion is there. Goldman estimates the actual price impact ranges from $1-15/barrel depending on the duration and severity of Hormuz disruption, and the base case is that Brent settles back into the gap by mid month.
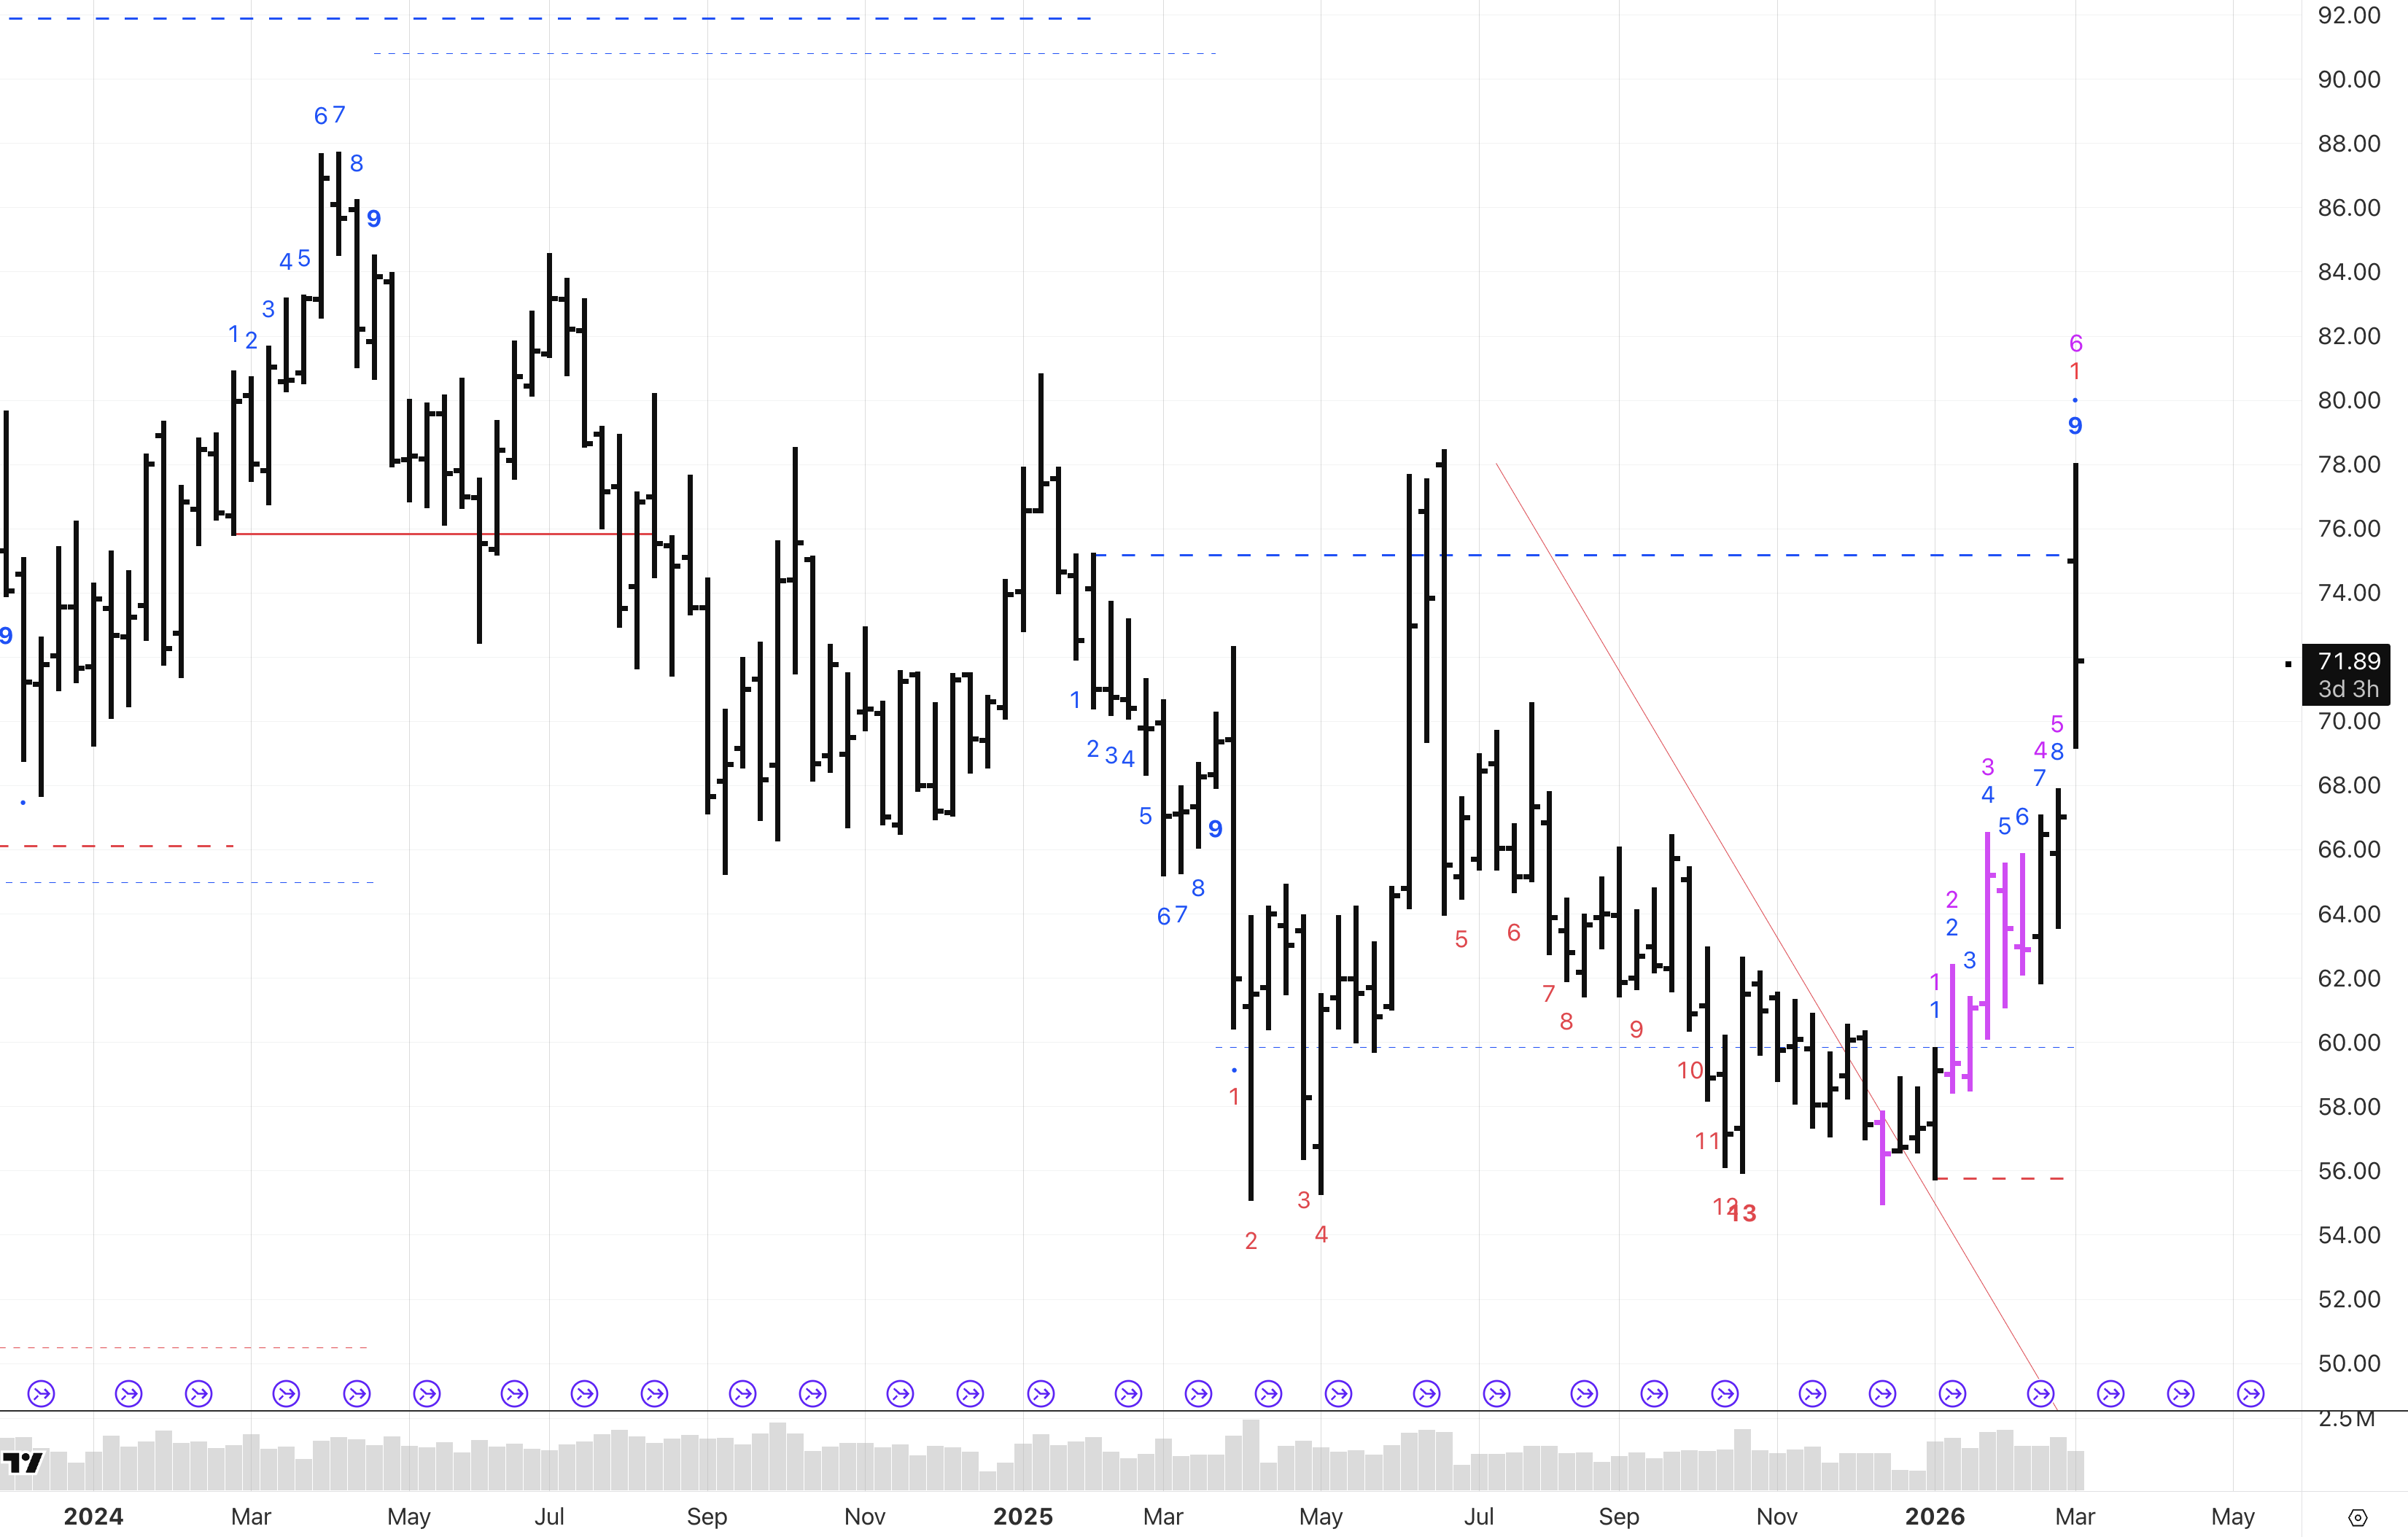
Here are the two charts I’m focused on this month for trading opportunities in smaller time frames. First is this weekly chart of crude showing a weekly 9 sell setup below TDST in the 75 range. As long as crude stays below this week’s high, I think its going to be short opportunity.
Likewise, we saw the dollar rally after completing weekly DeMark countdowns which we pointed out but now approaching resistance near the 100 area. I think if crude starts to head south this is an opportunity to ride the secular short dollar idea with a tight leash against the 101 area.