Florida’s Housing Inventory Trends Lower
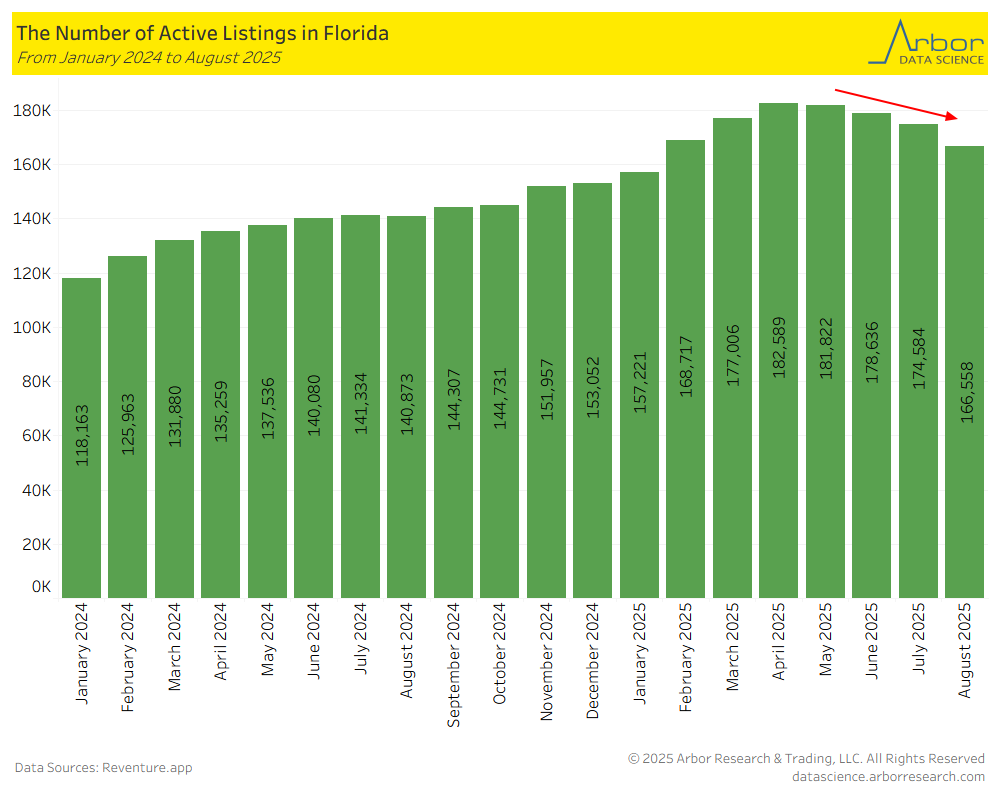
- The first chart illustrates the number of homes for sale, or active listings, in Florida from January 2024 to August 2025.
- After hitting a low at 118,163 in January 2024, the number of active listings increased to a high for the time period at 182,589 in April 2025. In August 2025, active listings declined to 166,558.
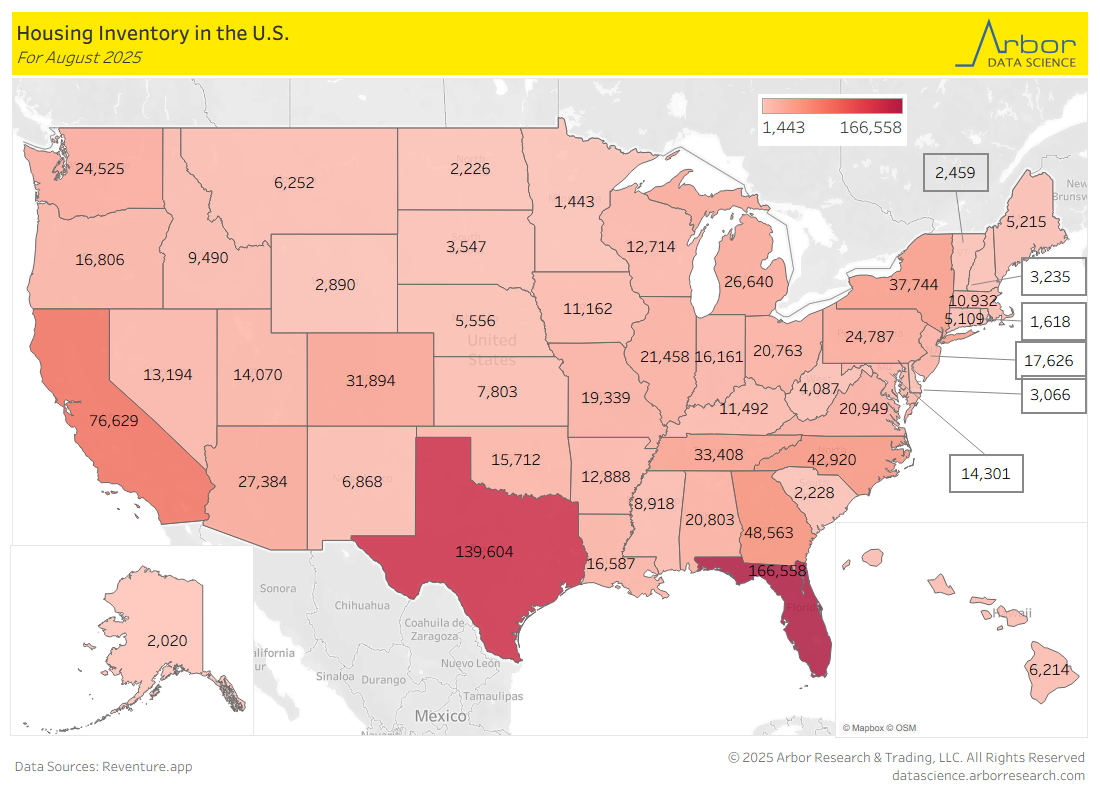
- Total housing inventory in the U.S. was 1,098,681 in August 2025 compared to a year ago in August 2024 at 908,944, according to Reventure.
- The states with the largest for sale inventory were: Florida at 166,558, followed by Texas at 139,604 and California at 76,629.
- The states with the smallest for sale inventory were: Minnesota at 1,443, followed by Rhode Island 1,618 and Alaska at 2,020.
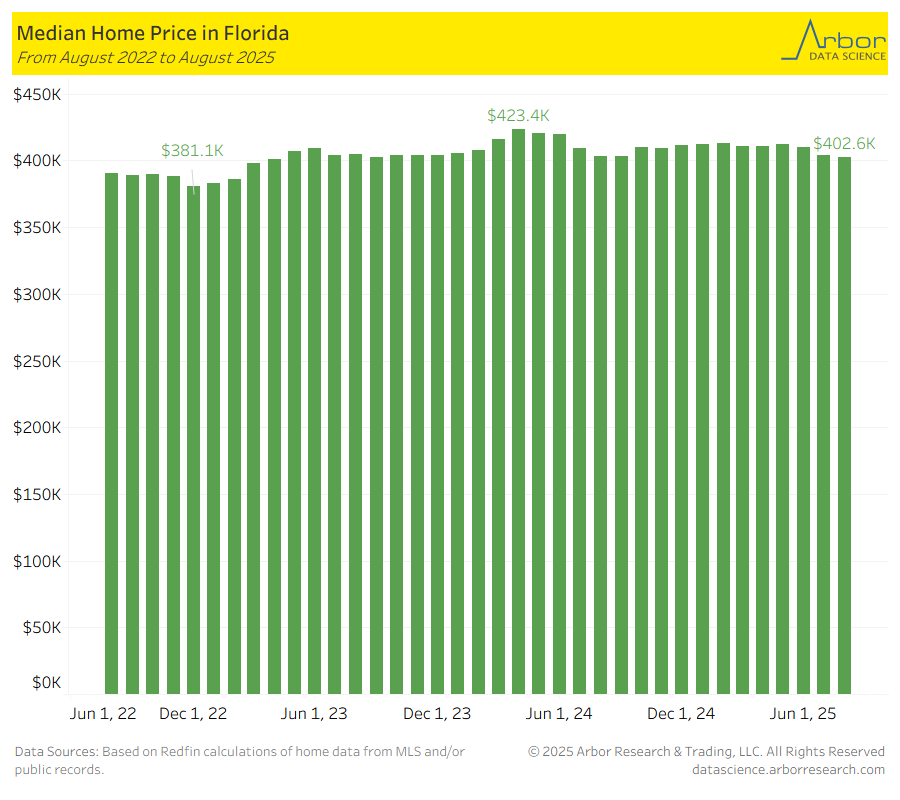
Median Home Price in Florida was $402,600 in August 2025
- According to Redfin, the chat below outlines the median home price in Florida as a 3 year rolling period from August 2022 to August 2025.
- The median home price in Florida decreased month-over-month to $402,600 in August 2025 from $403,900 in July 2025.
- The peak median sales price in Florida last year was in April 2024 at $423,400 and the low was $381,000 in December 2022.
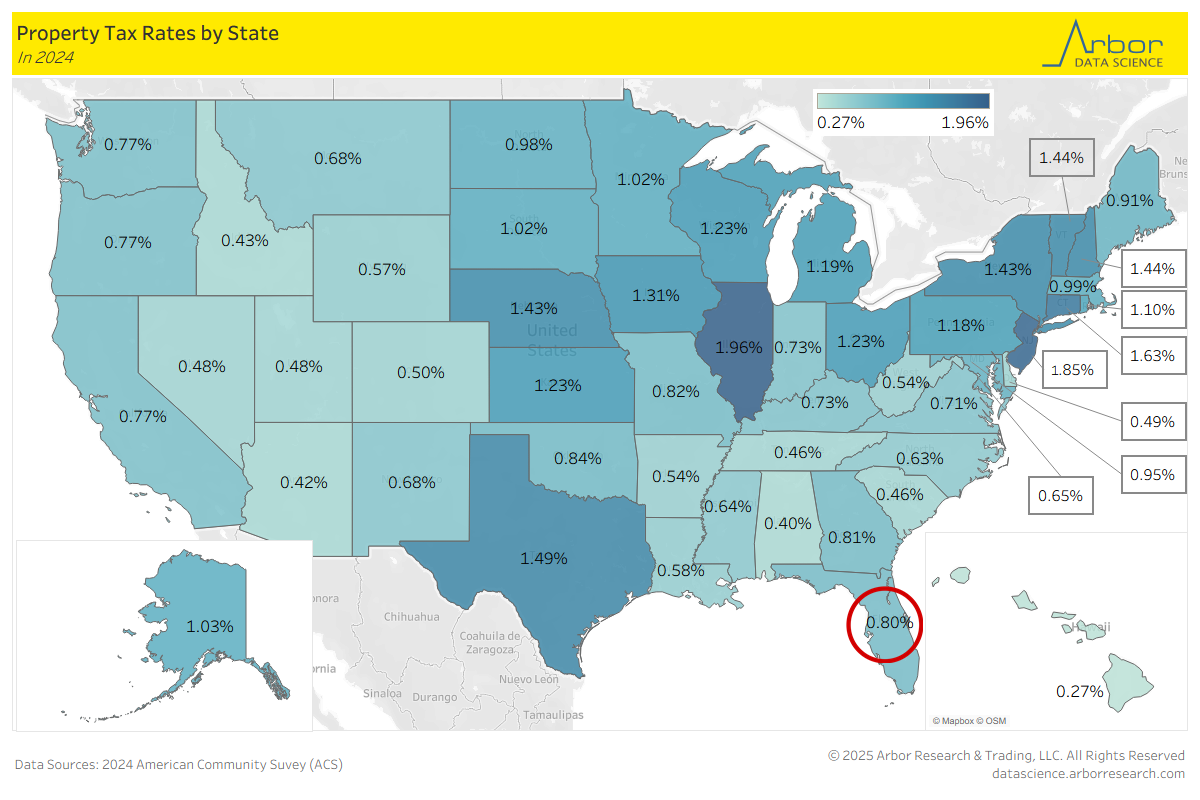
Property Taxes by State
- Florida’s Governor Ron DeSantis has proposed to abolish property taxes in 2026. Given this news, we examine property taxes across the U.S. in 2024. For reference, the property tax in Florida was 0.80% in 2024.
- The states with the highest property taxes were: Illinois at 1.96%, followed by New Jersey at 1.85% and Connecticut at 1.63%.
- The states with the lowest property taxes were: Hawaii at 0.27%, followed by Alabama at 0.40% and Arizona at 0.42%.
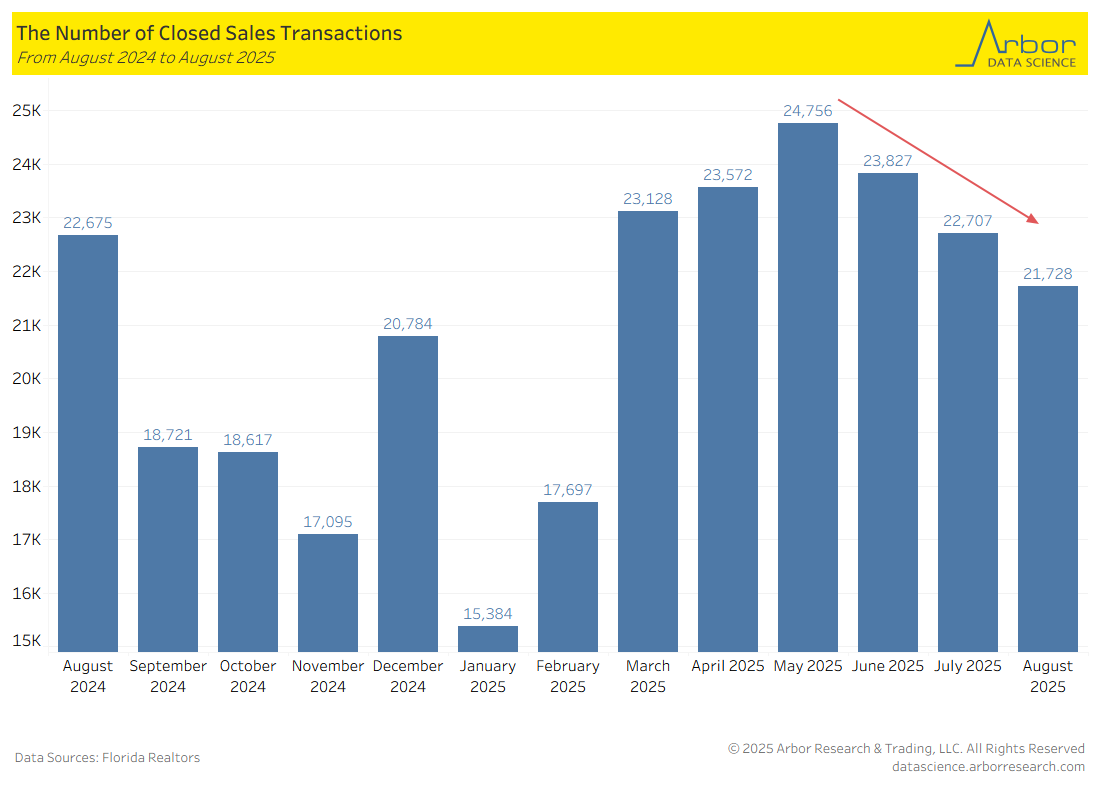
Closed Sales Transactions Declined in August 2025
- Utilizing data from Florida Realtors, the chart below outlines the number of sales transactions for single family homes that closed during each month from August 2024 to August 2025.
- Florida’s closed transactions hit a low of 15,384 in January 2025 and a peak of 24,756 in May 2025. In August 2025, the number of closed transactions declined to 21,728.
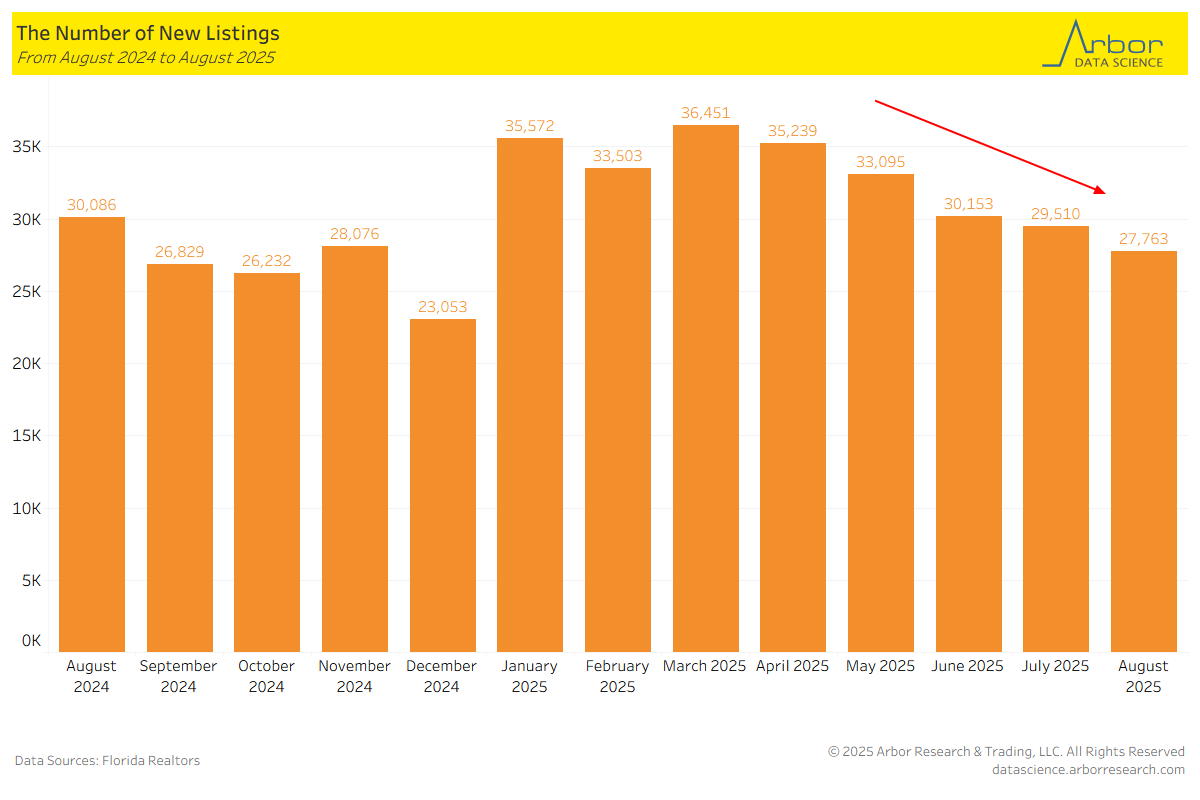
The Number of New Listings Declined
- The chart below highlights the number of new single family home listings on the market during each month from August 2024 to August 2025.
- In August 2025, the number of new listings declined to 27,763, down from the peak for the time period at 36,451.