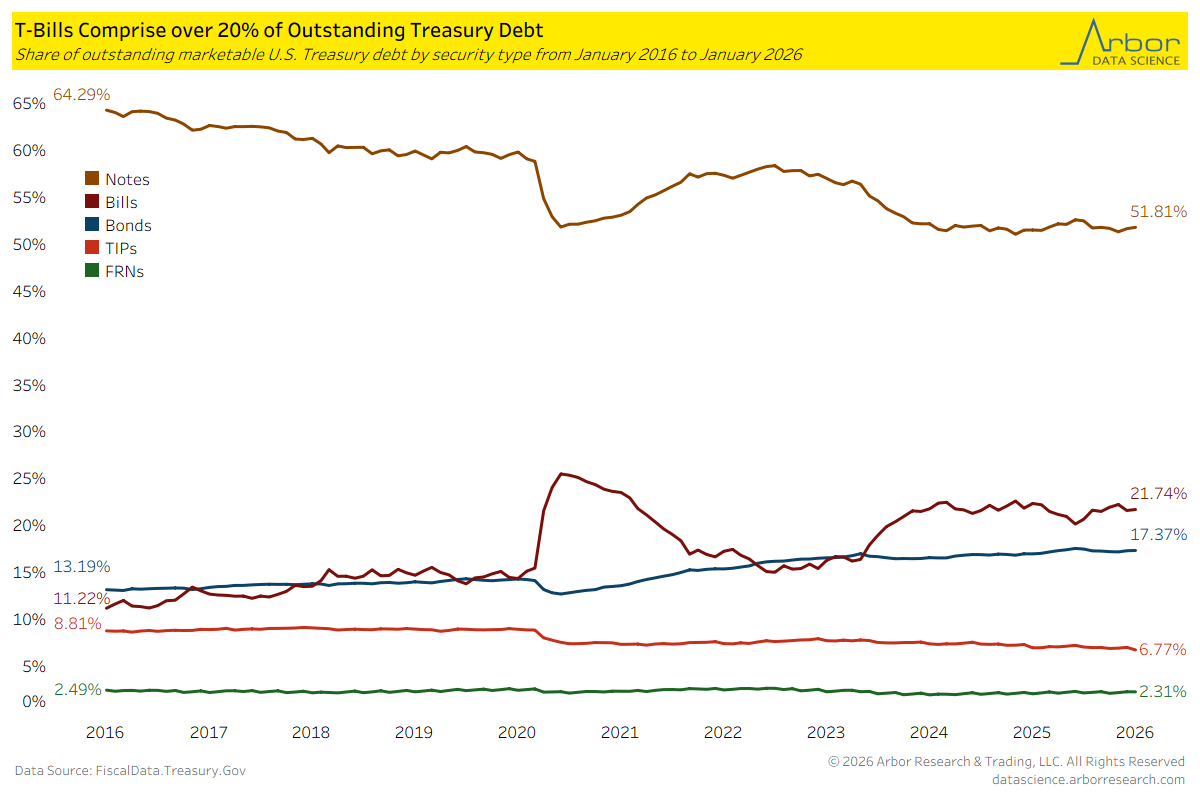
The Shifting Compostion of U.S. Treasury Debt
- T-Bills were 21.74% of outstanding debt in January 2026, almost double the level of 11.22% ten years prior.
- Treasury Notes were the largest share of outstanding marketable debt in January 2026, at 51.81%. This has trended down since January 2016, when it was 64.29% of all debt.
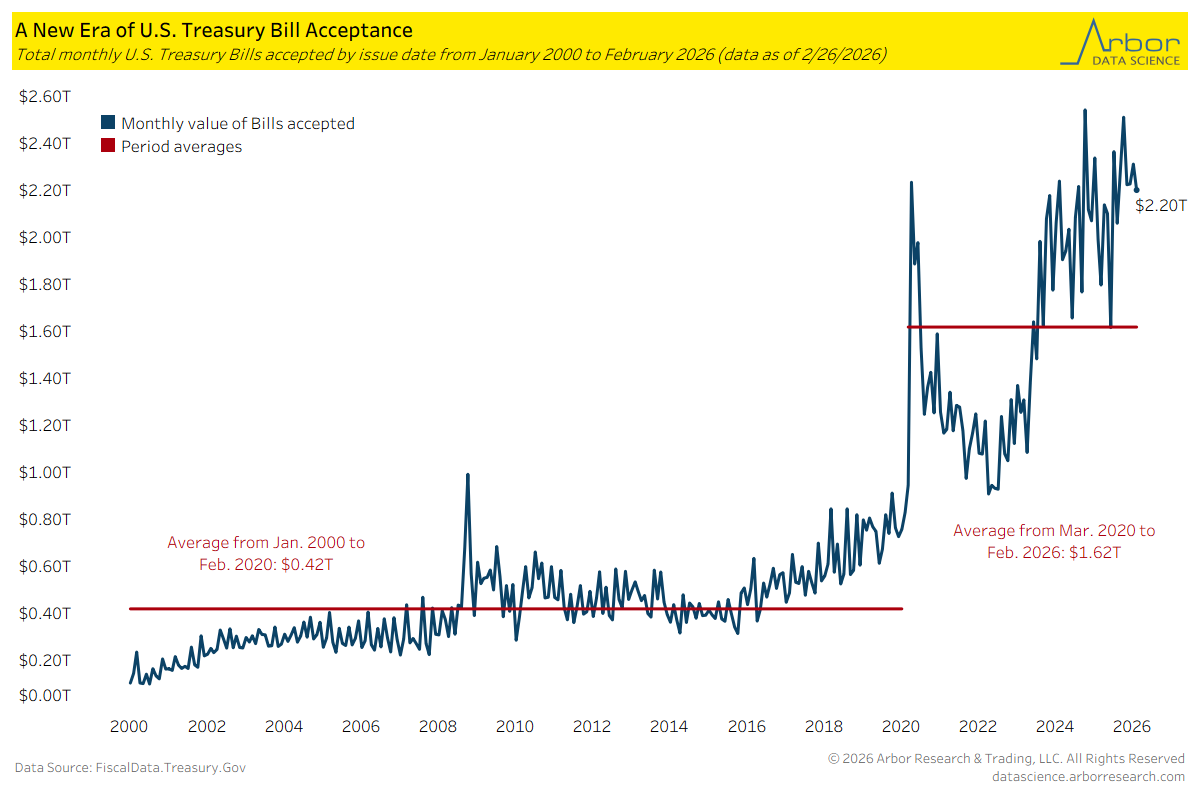
T-Bill Acceptance Booms in the 2020s
- There were $2.20 trillion worth of T-Bills accepted at auction in February 2026. While this reading was down from the prior month, it was $1 trillion higher than any month from January 2000 to February 2020.
- The monthly average of T-Bills accepted at auction was $0.42 trillion from January 2000 to February 2020. From March 2020 to February 2026, the monthly average was $1.62 trillion, which was almost four times the average from the previous period.
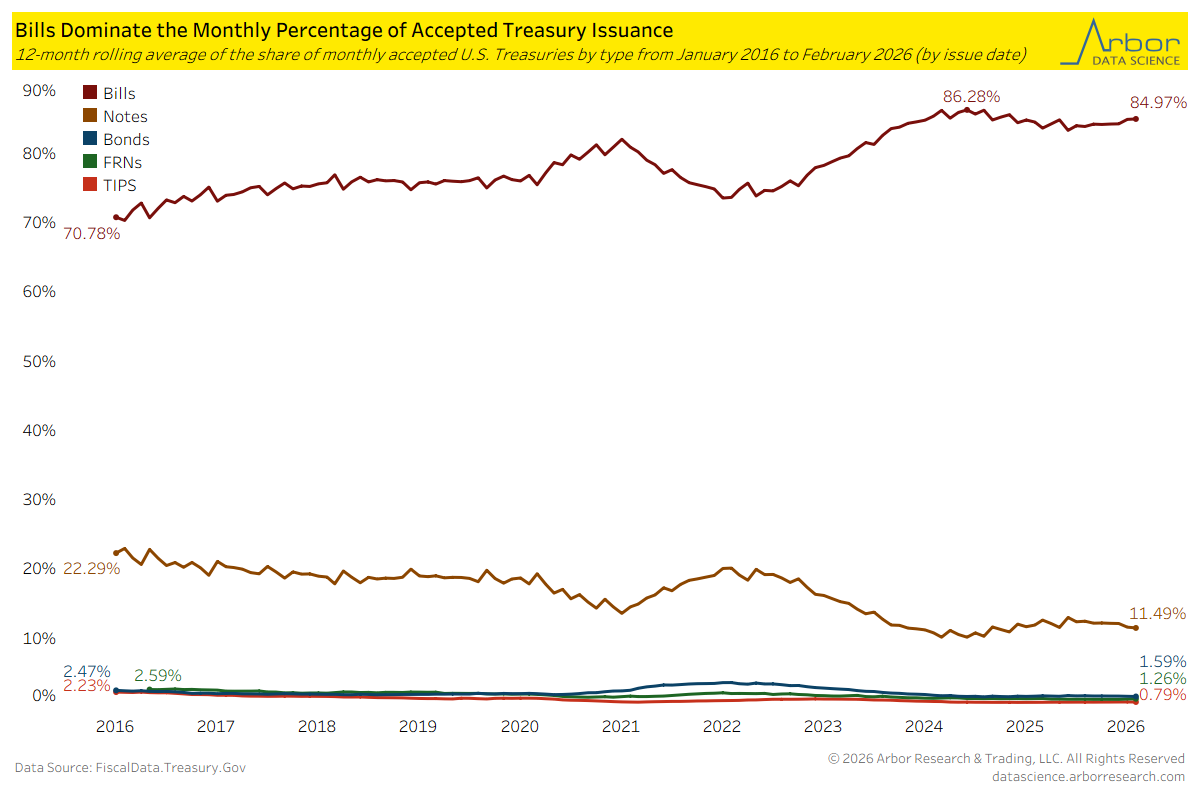
Breaking Down the Share of Debt Accepted at Auction
- The following figures are all 12-month rolling averages. This calculation was done to examine the change in overall trends rather than month-to-month differences.
- T-Bills were 84.97% of all accepted Treasury debt in February 2026. This was down slightly from the period (January 2016 to February 2026) high of 86.28% recorded in June 2024, but still above the reading of 70.78% in January 2016.
- Treasury Notes decreased from 22.29% of all accepted debt in January 2016 to 11.49% in February 2026.
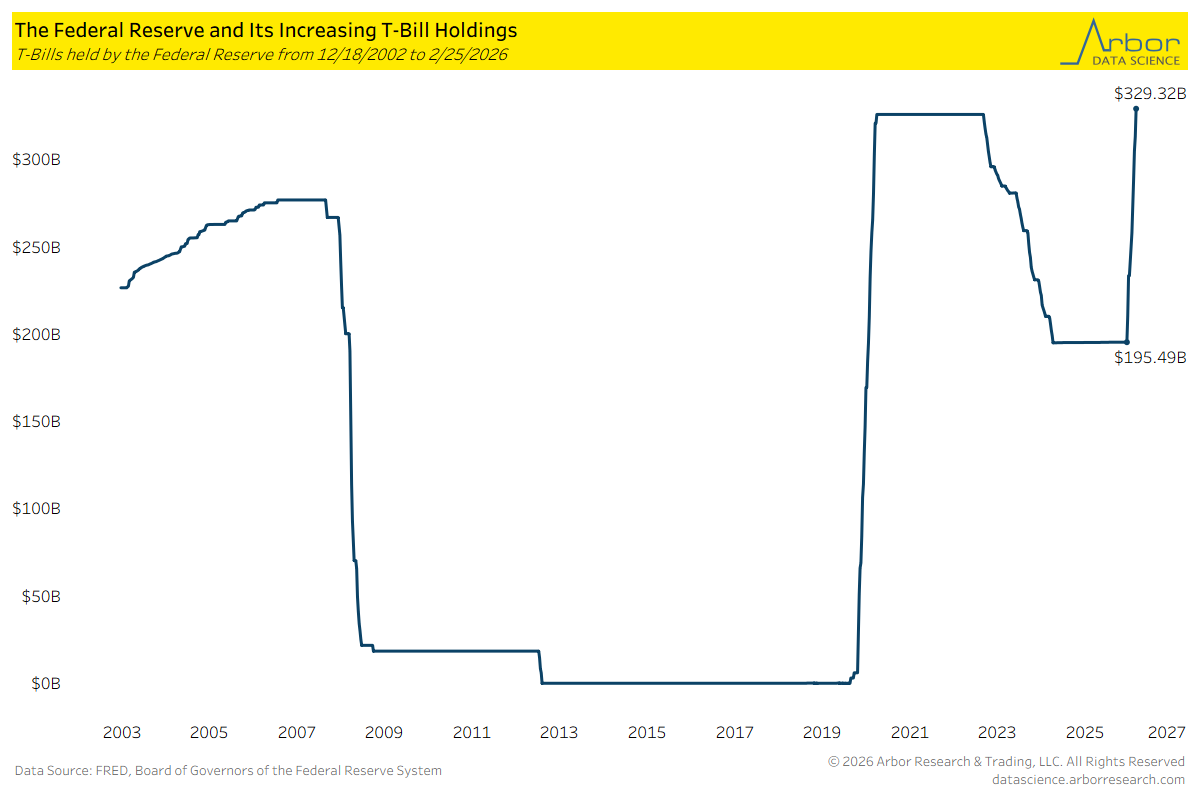
The Fed’s Growing Holdings of T-Bills
- The Federal Reserve’s Secured Open Market Account (SOMA) held $329.32 billion worth of T-Bills for the week ended 2/25/2026. This was the highest level of holdings over the period from 12/18/2002 to 2/25/2026.
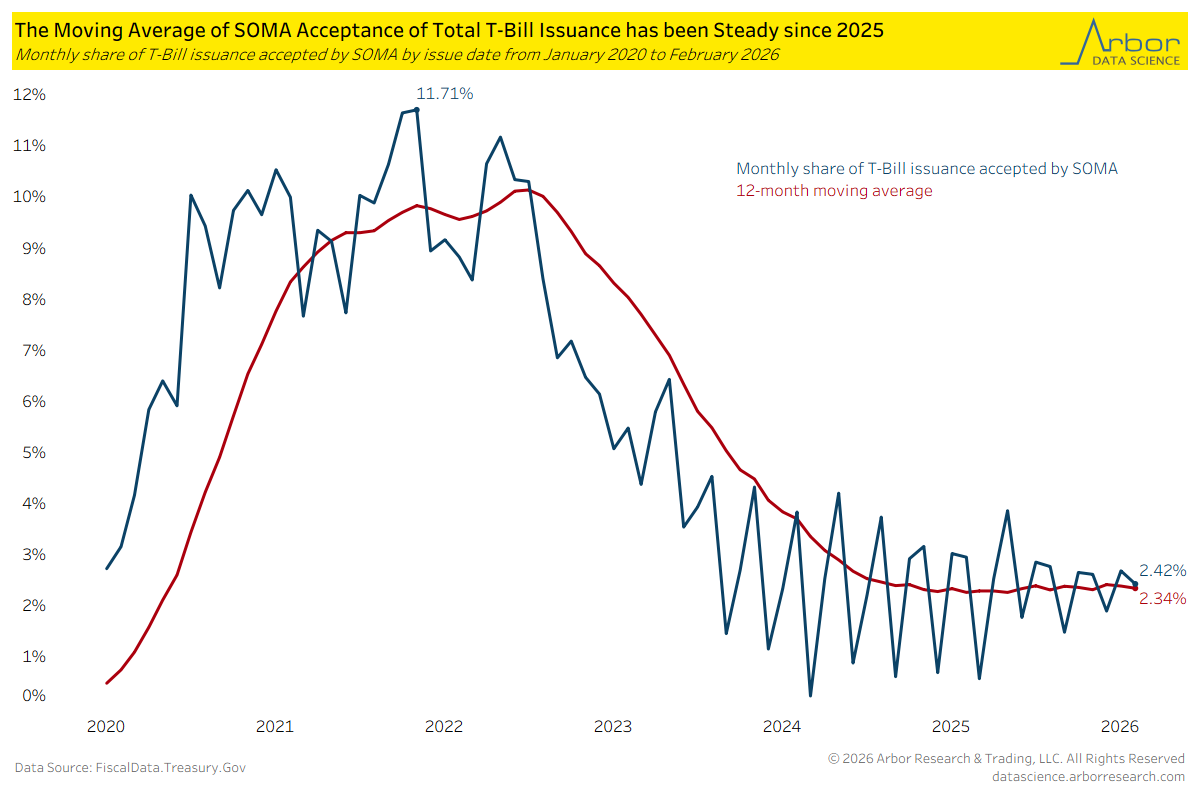
SOMA Share of T-Bill Acceptance Stabilizes
- The Fed’s SOMA acccepted 2.42% of all T-Bills issued in February 2026. The share taken in by SOMA peaked for the period (January 2020 to February 2026) in November 2021 at 11.71%
- The 12-month moving average of total T-Bill issuance accepted by SOMA was 2.34% in February 2026. This average was stable in the mid 2 percents over the past 18 months (September 2024 to February 2026). From May 2021 to October 2022, the average was above 9%.
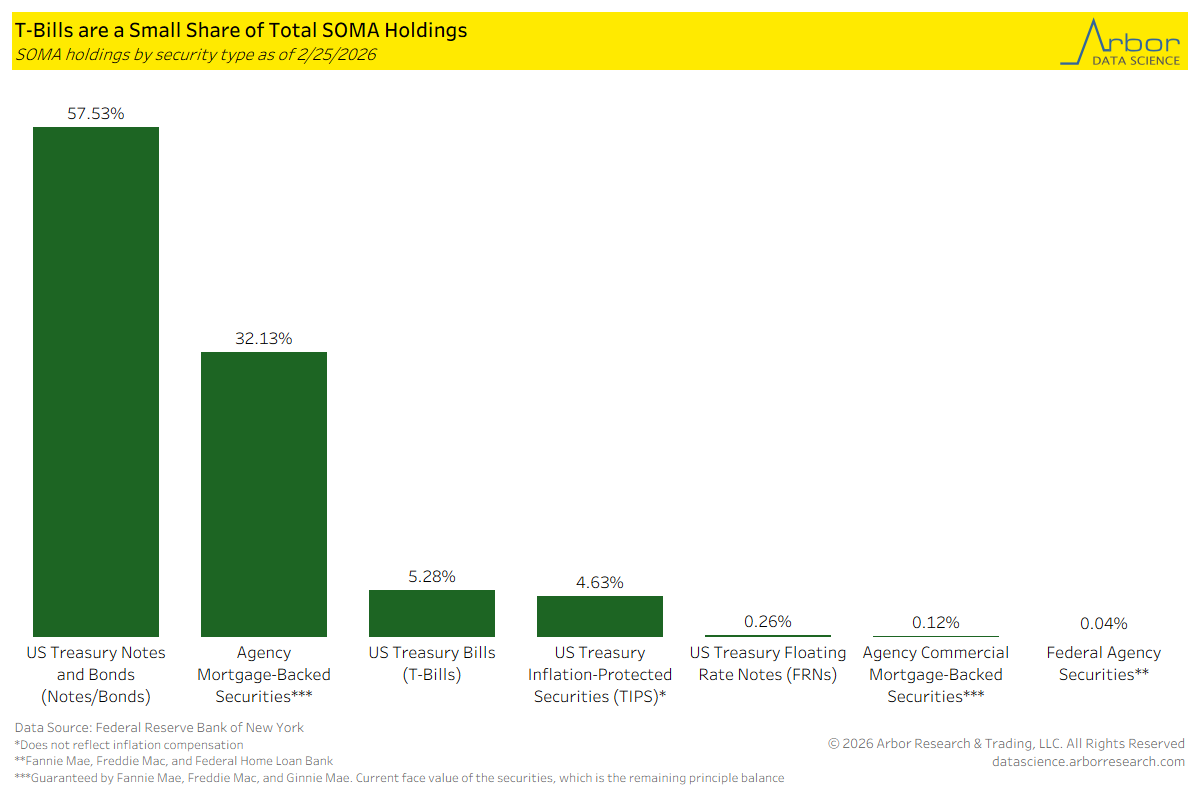
T-Bills are a Small Share of Total SOMA Holdings
- U.S. Treasury Notes and Bonds comprised 57.53% of all SOMA holdings as of 2/25/2026. This was the largest share of any security type.
- T-Bills were 5.28% of all SOMA holdings, which was the third-largest share.