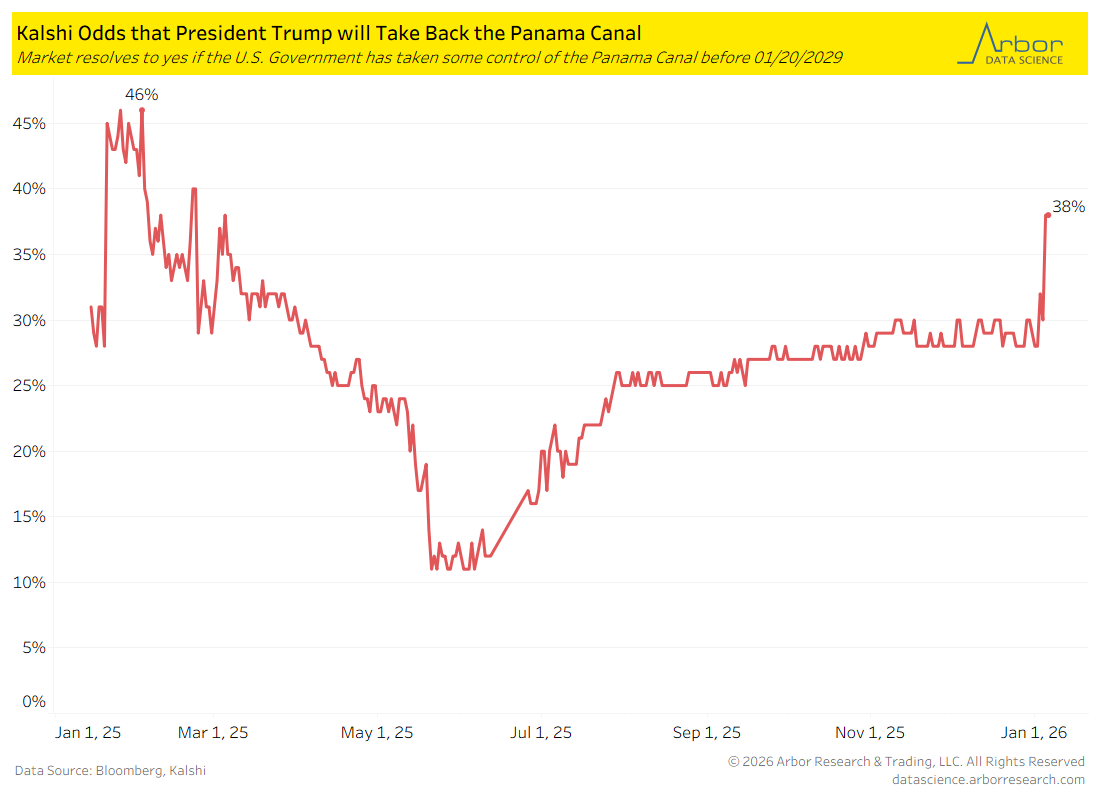
Will the U.S. Take Control of the Panama Canal?
- One prediction market listed on Kalshi allows traders to speculate on whether President Trump and the U.S. Government will retake control of the Panama Canal. This market traded sideways in a range of 25% to 28% from July 2025 to early January 2026. The odds on the U.S. taking control before January 2029 increased to 38% on 01/05/2026.
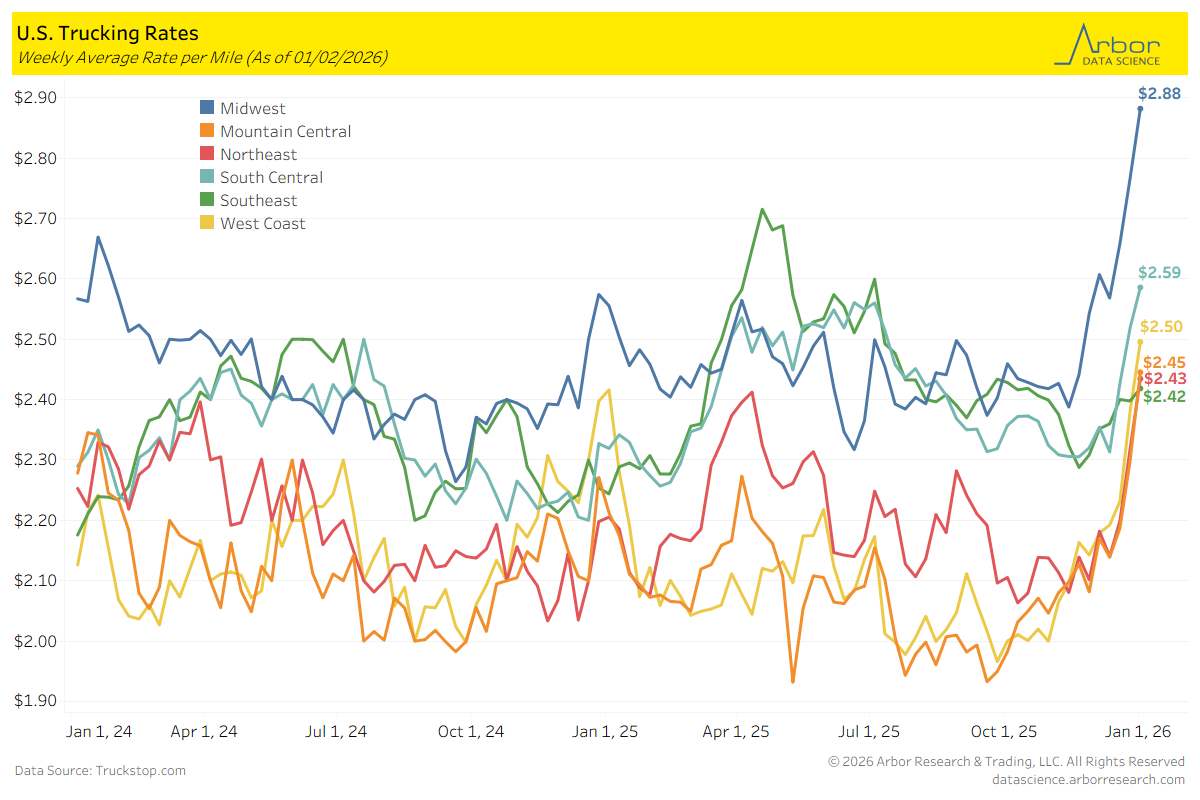
U.S. Trucking Rates
- The Internet Trucks Spot Average Equipment rate was $2.56 per mile as of 01/02/2026.
- Trucking rates on a geographical basis increased over the past two weeks. Rates for the West Coast and Mountain Central regions each increased by increased $0.26 per mile, the largest increase among the various regions.
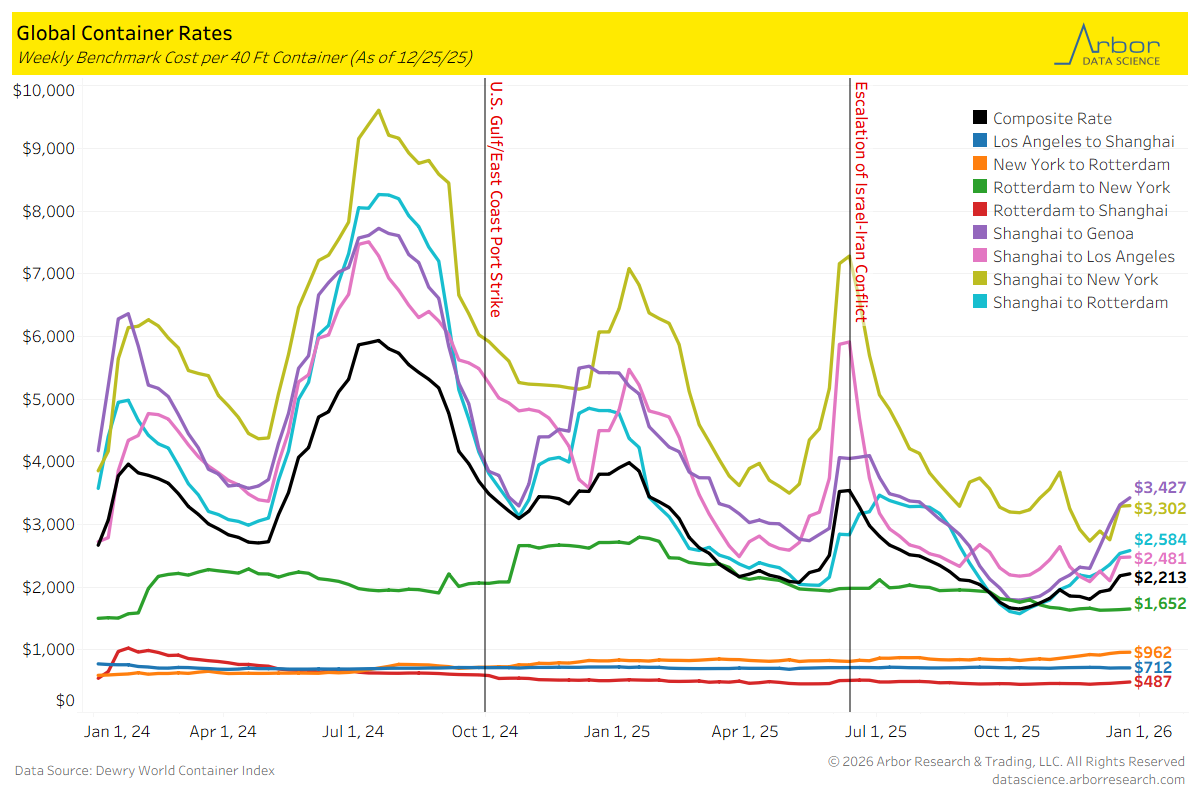
Global Container Rates
- The composite rate per 40-foot container was $2,213 on 12/25/2025, which is up $31 from 12/18/2025. Global container rates increased over from 12/18/2025 to 12/25/2025. The largest increase was from Shanghai to Genoa which increased $113 to $3,427. The second-largest increase was from Shanghai to Rotterdam, which increased $45 to $2,539.
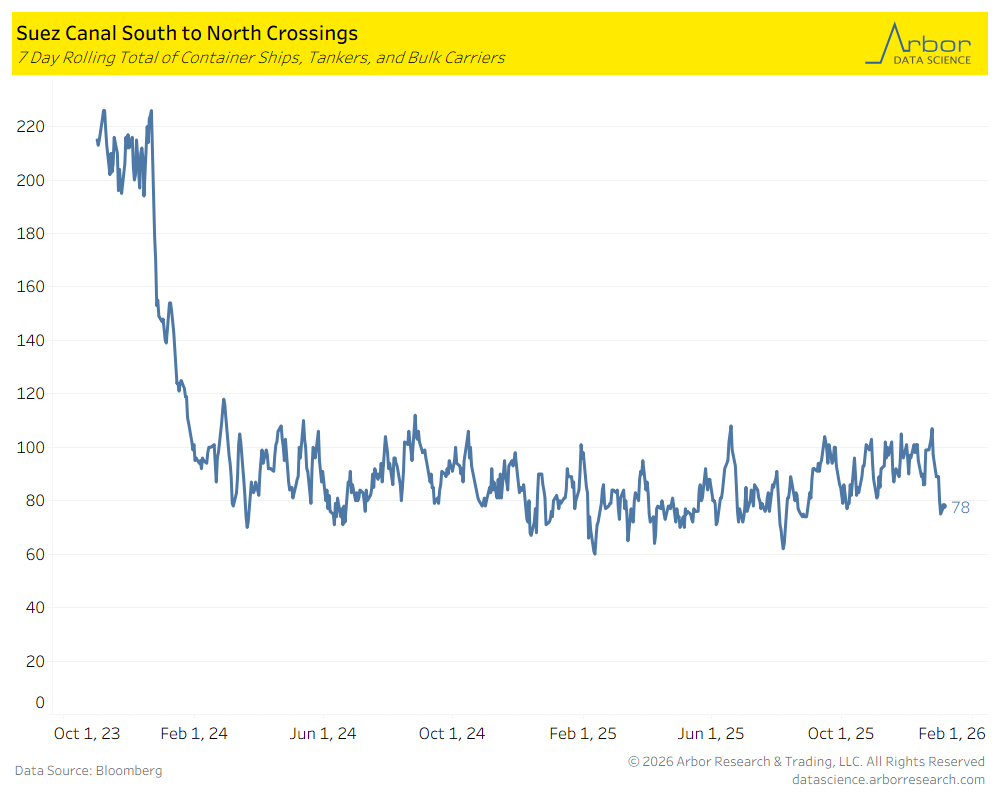
Suez Canal Crossings
- The chart below outlines the 7-day rolling total of container ships, tankers, and bulk carriers traveling South to North through the Suez Canal.
- The total number of crossings on 01/05/2026 was 78 (compared to 82 on 01/06/2025 and 139 on 01/05/2024).
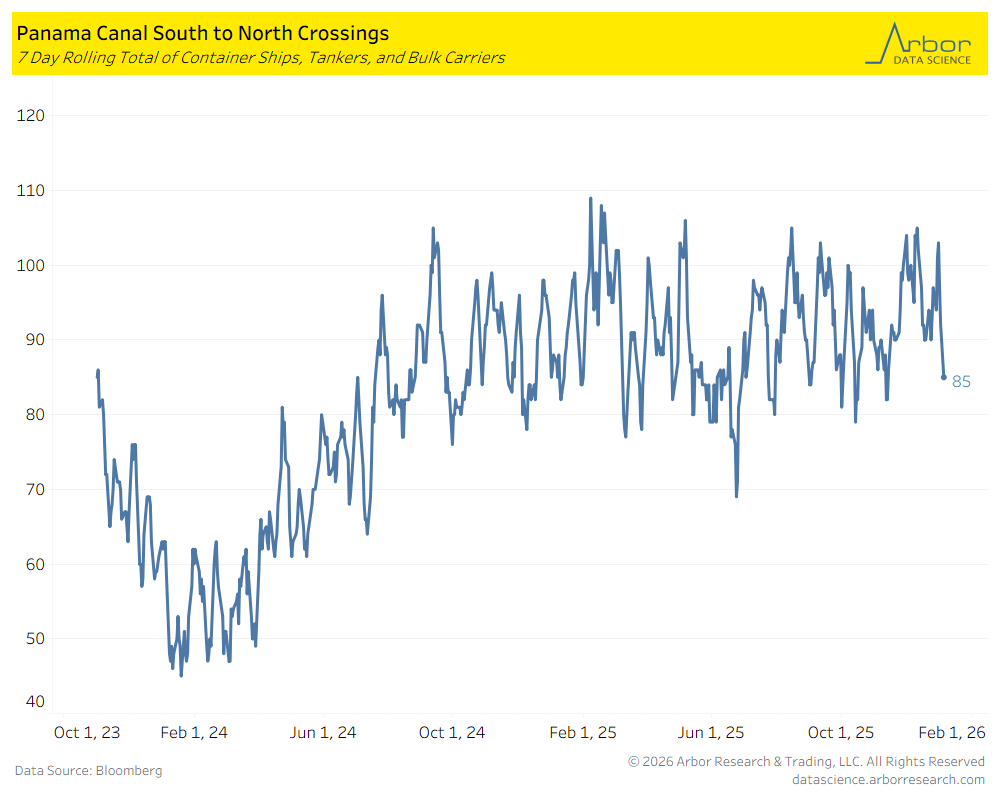
Panama Canal Crossings
- The chart below outlines the 7-day rolling total of container ships, tankers, and bulk carriers traveling South to North through the Panama Canal.
- The total number of crossings on 01/05/2026 was 85 (compared to 87 on 01/06/2025).
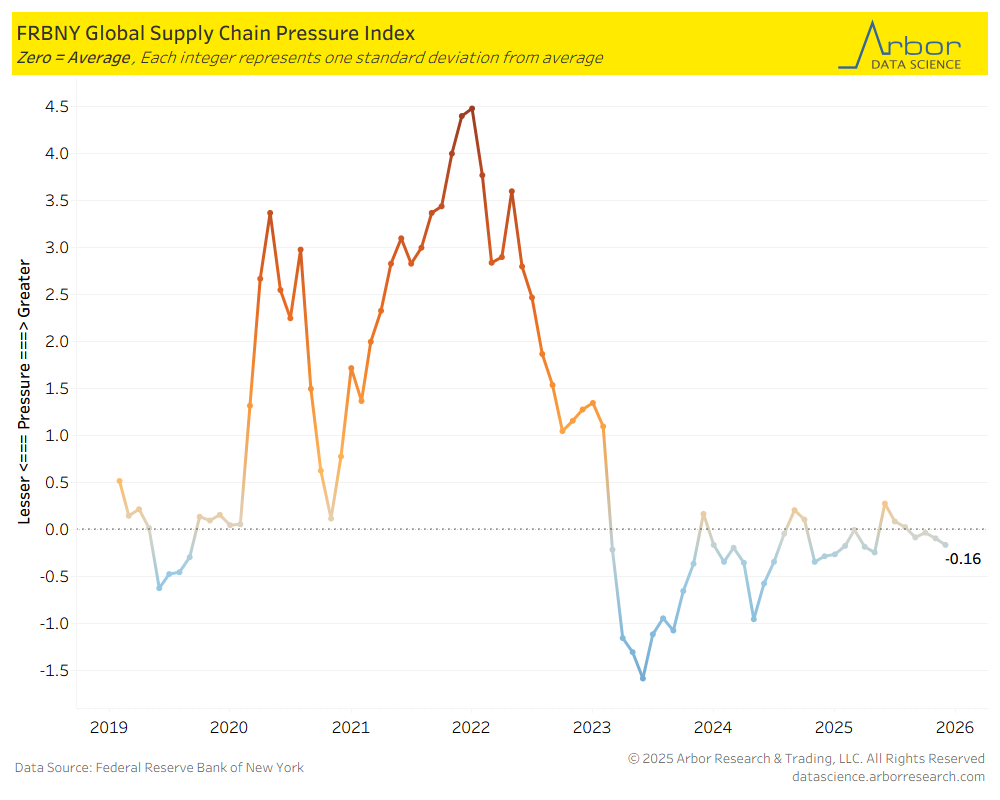
Global Supply Chain Pressure Index
- The Federal Reserve Bank of New York’s Global Supply Chain Pressure Index (GSCPI) decreased from –0.06 in October 2025 to -0.16 for November 2025.
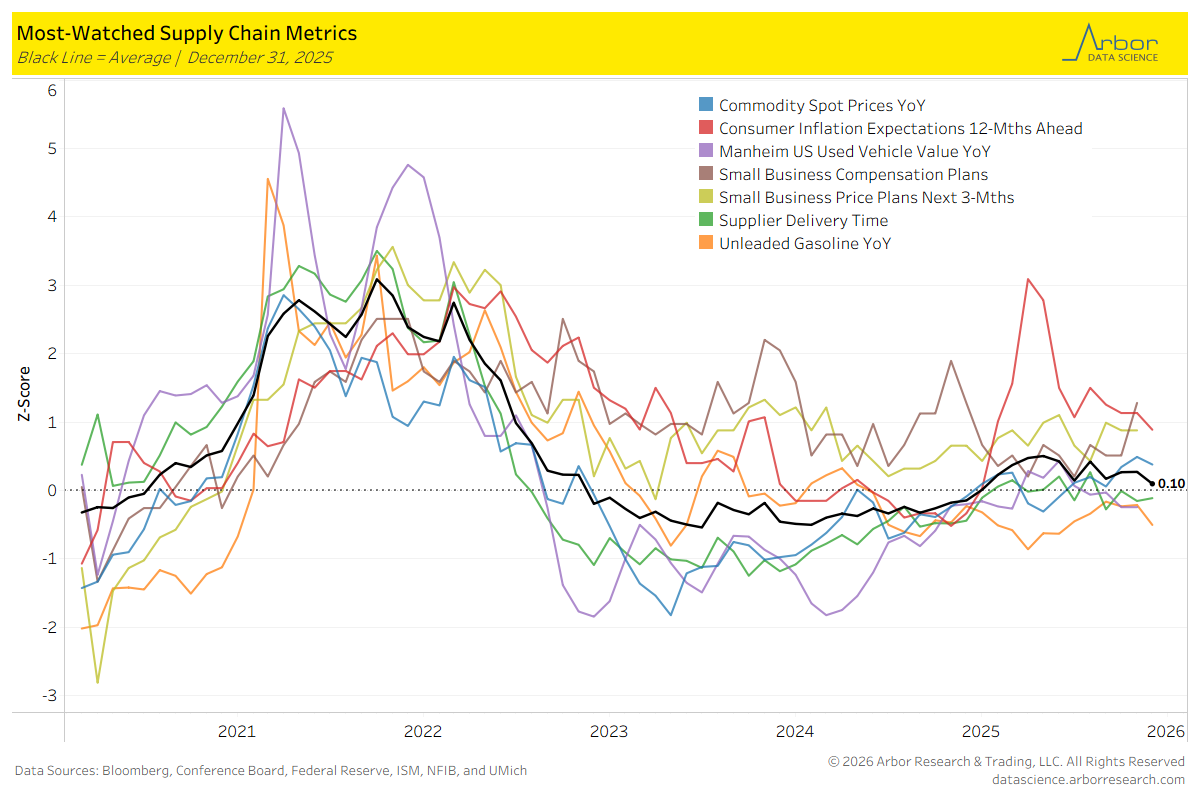
Most-Watched Supply Chain Metrics
- The chart below is a breakdown of supply chain metrics for December 2025.
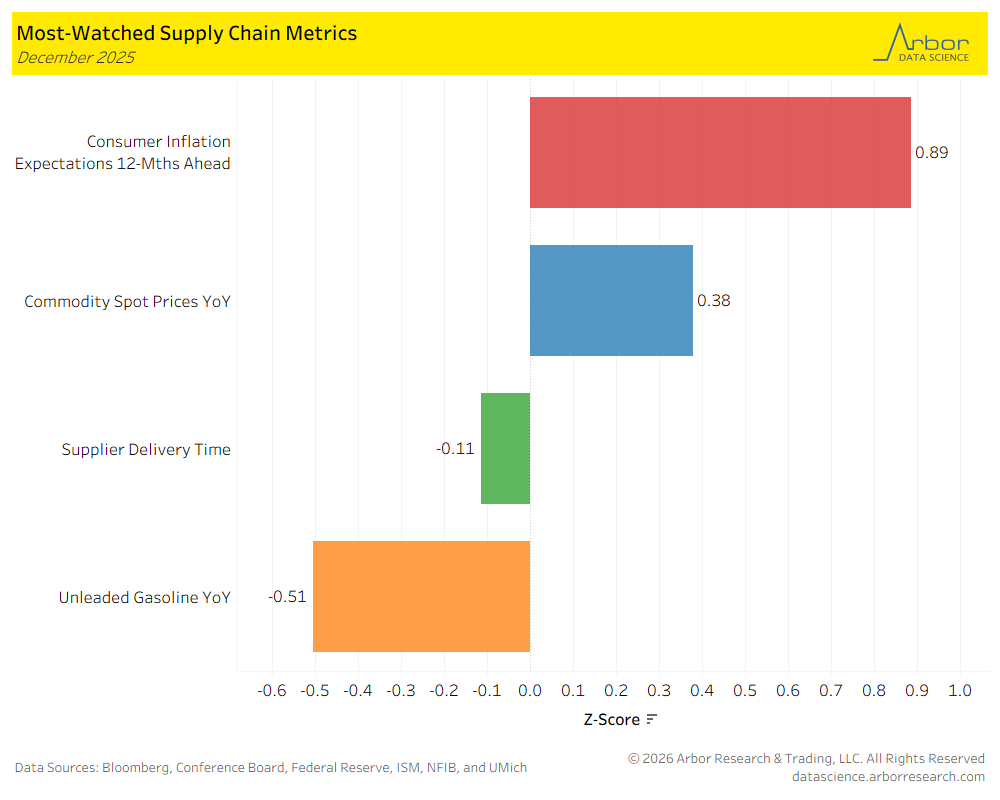
- The aggregate index of most-watched supply chain metrics (the black line in the chart below) was 0.30, with zero meaning the supply chain is acting normally.
Tables