Coming into 2026 the market expected the Fed to be cutting rates. That pricing is dead. The Iran war put energy prices into the inflation numbers — CPI is running 3.8%, the highest since May 2023 — and the May jobs report removed the labor-market excuse. Payrolls came in at +172K against an +80K consensus, March and April were revised up a combined +93K, and unemployment held at 4.3% for a third straight month. Goldman pulled both of its 2026 cuts entirely, pushing them to mid and late 2027, and doubled its hike probability to 20%. Futures are more aggressive than that: roughly 70% odds of a hike by year-end as of Friday.
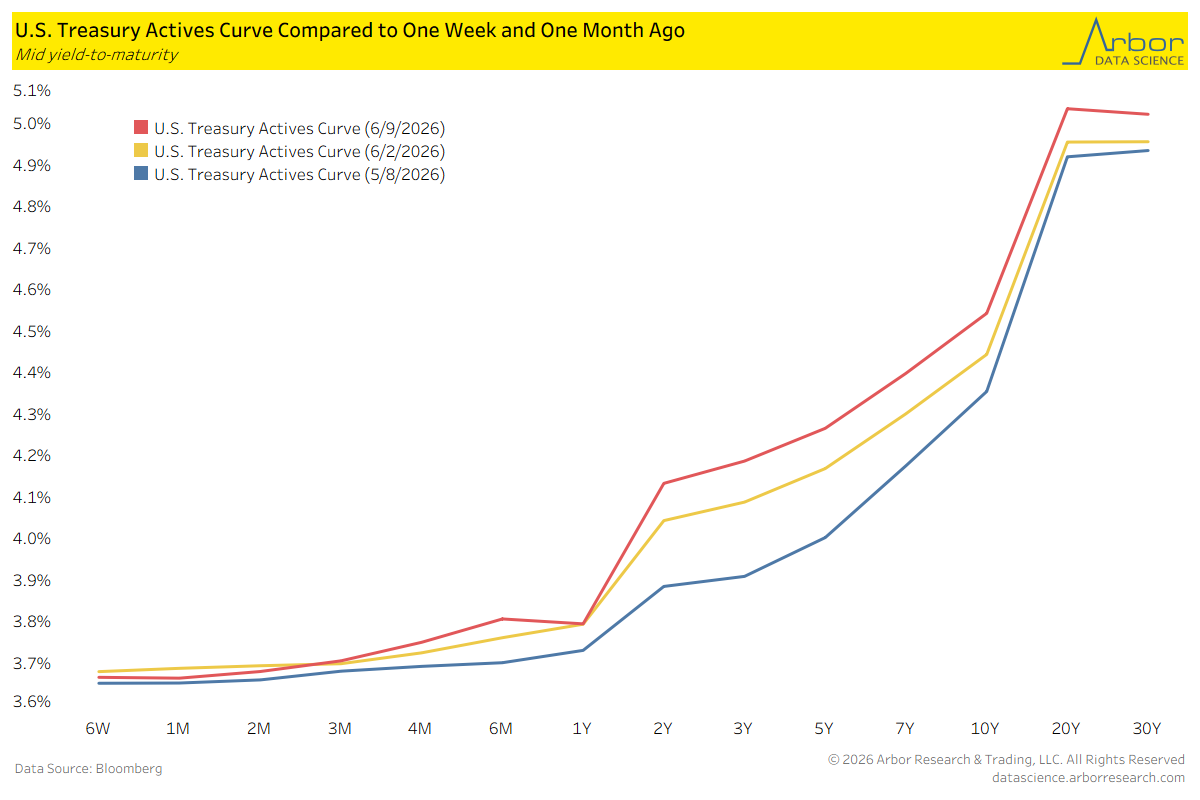
The complication is that risk assets just cracked. Friday was the worst session since October — Nasdaq down 4.18%, its biggest drop since April 2025, S&P down 2.64%, the first losing week in ten — three days after the S&P closed above 7,600 for the first time. The proximate cause was the chip selloff plus the yield spike off the jobs number, with the 10-year at 4.54% and the 20s and 30s back above 5%. Hawkish repricing into a tape this fragile is self-limiting. If equities keep falling and the growth data softens, the same futures market that’s pricing a 70% hike probability will price it right back out.
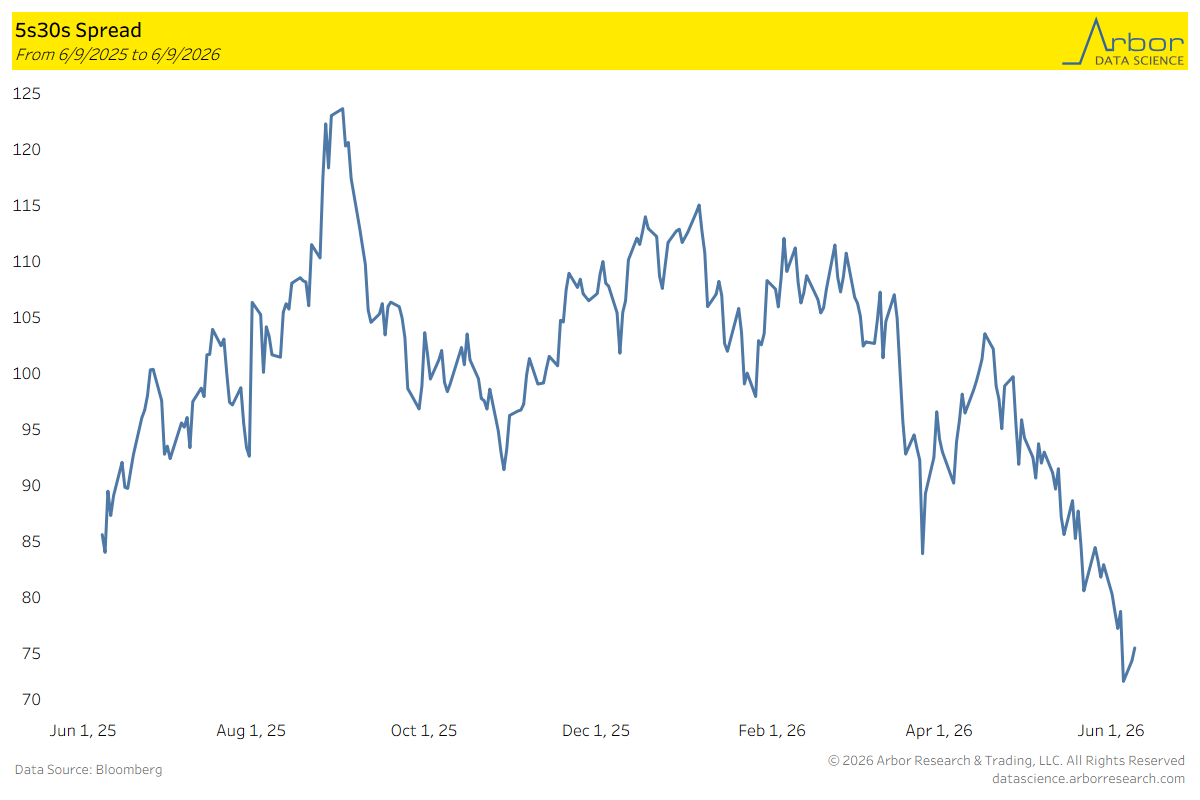
The 5s30s are flattening. The spread peaked near 124bps in early September 2025, when cut expectations were at their maximum ahead of the Fed’s 75bps of late-2025 easing. It held a 95-115 range through the winter, took a sharp dip to ~84 in early April, recovered to ~104 in early May, and has since collapsed to the low 70s — a 30bp flattening in five weeks and the low of the entire 12-month window.
Which sets up the asymmetry. If the equity selloff deepens and forces the hike pricing back out, the unwind runs through the same channel in reverse — the belly rallies first and the curve re-steepens from the front. A steepener at the flattest print in a year is the expression if you think Friday’s tape matters more than Friday’s payroll number. The risk to it is carry and the June FOMC validating the hawks. Either way the position sizes off the same observation: the curve is at an extreme, pricing has flipped twice in six months, and nothing in the data flow suggests it’s done flipping.
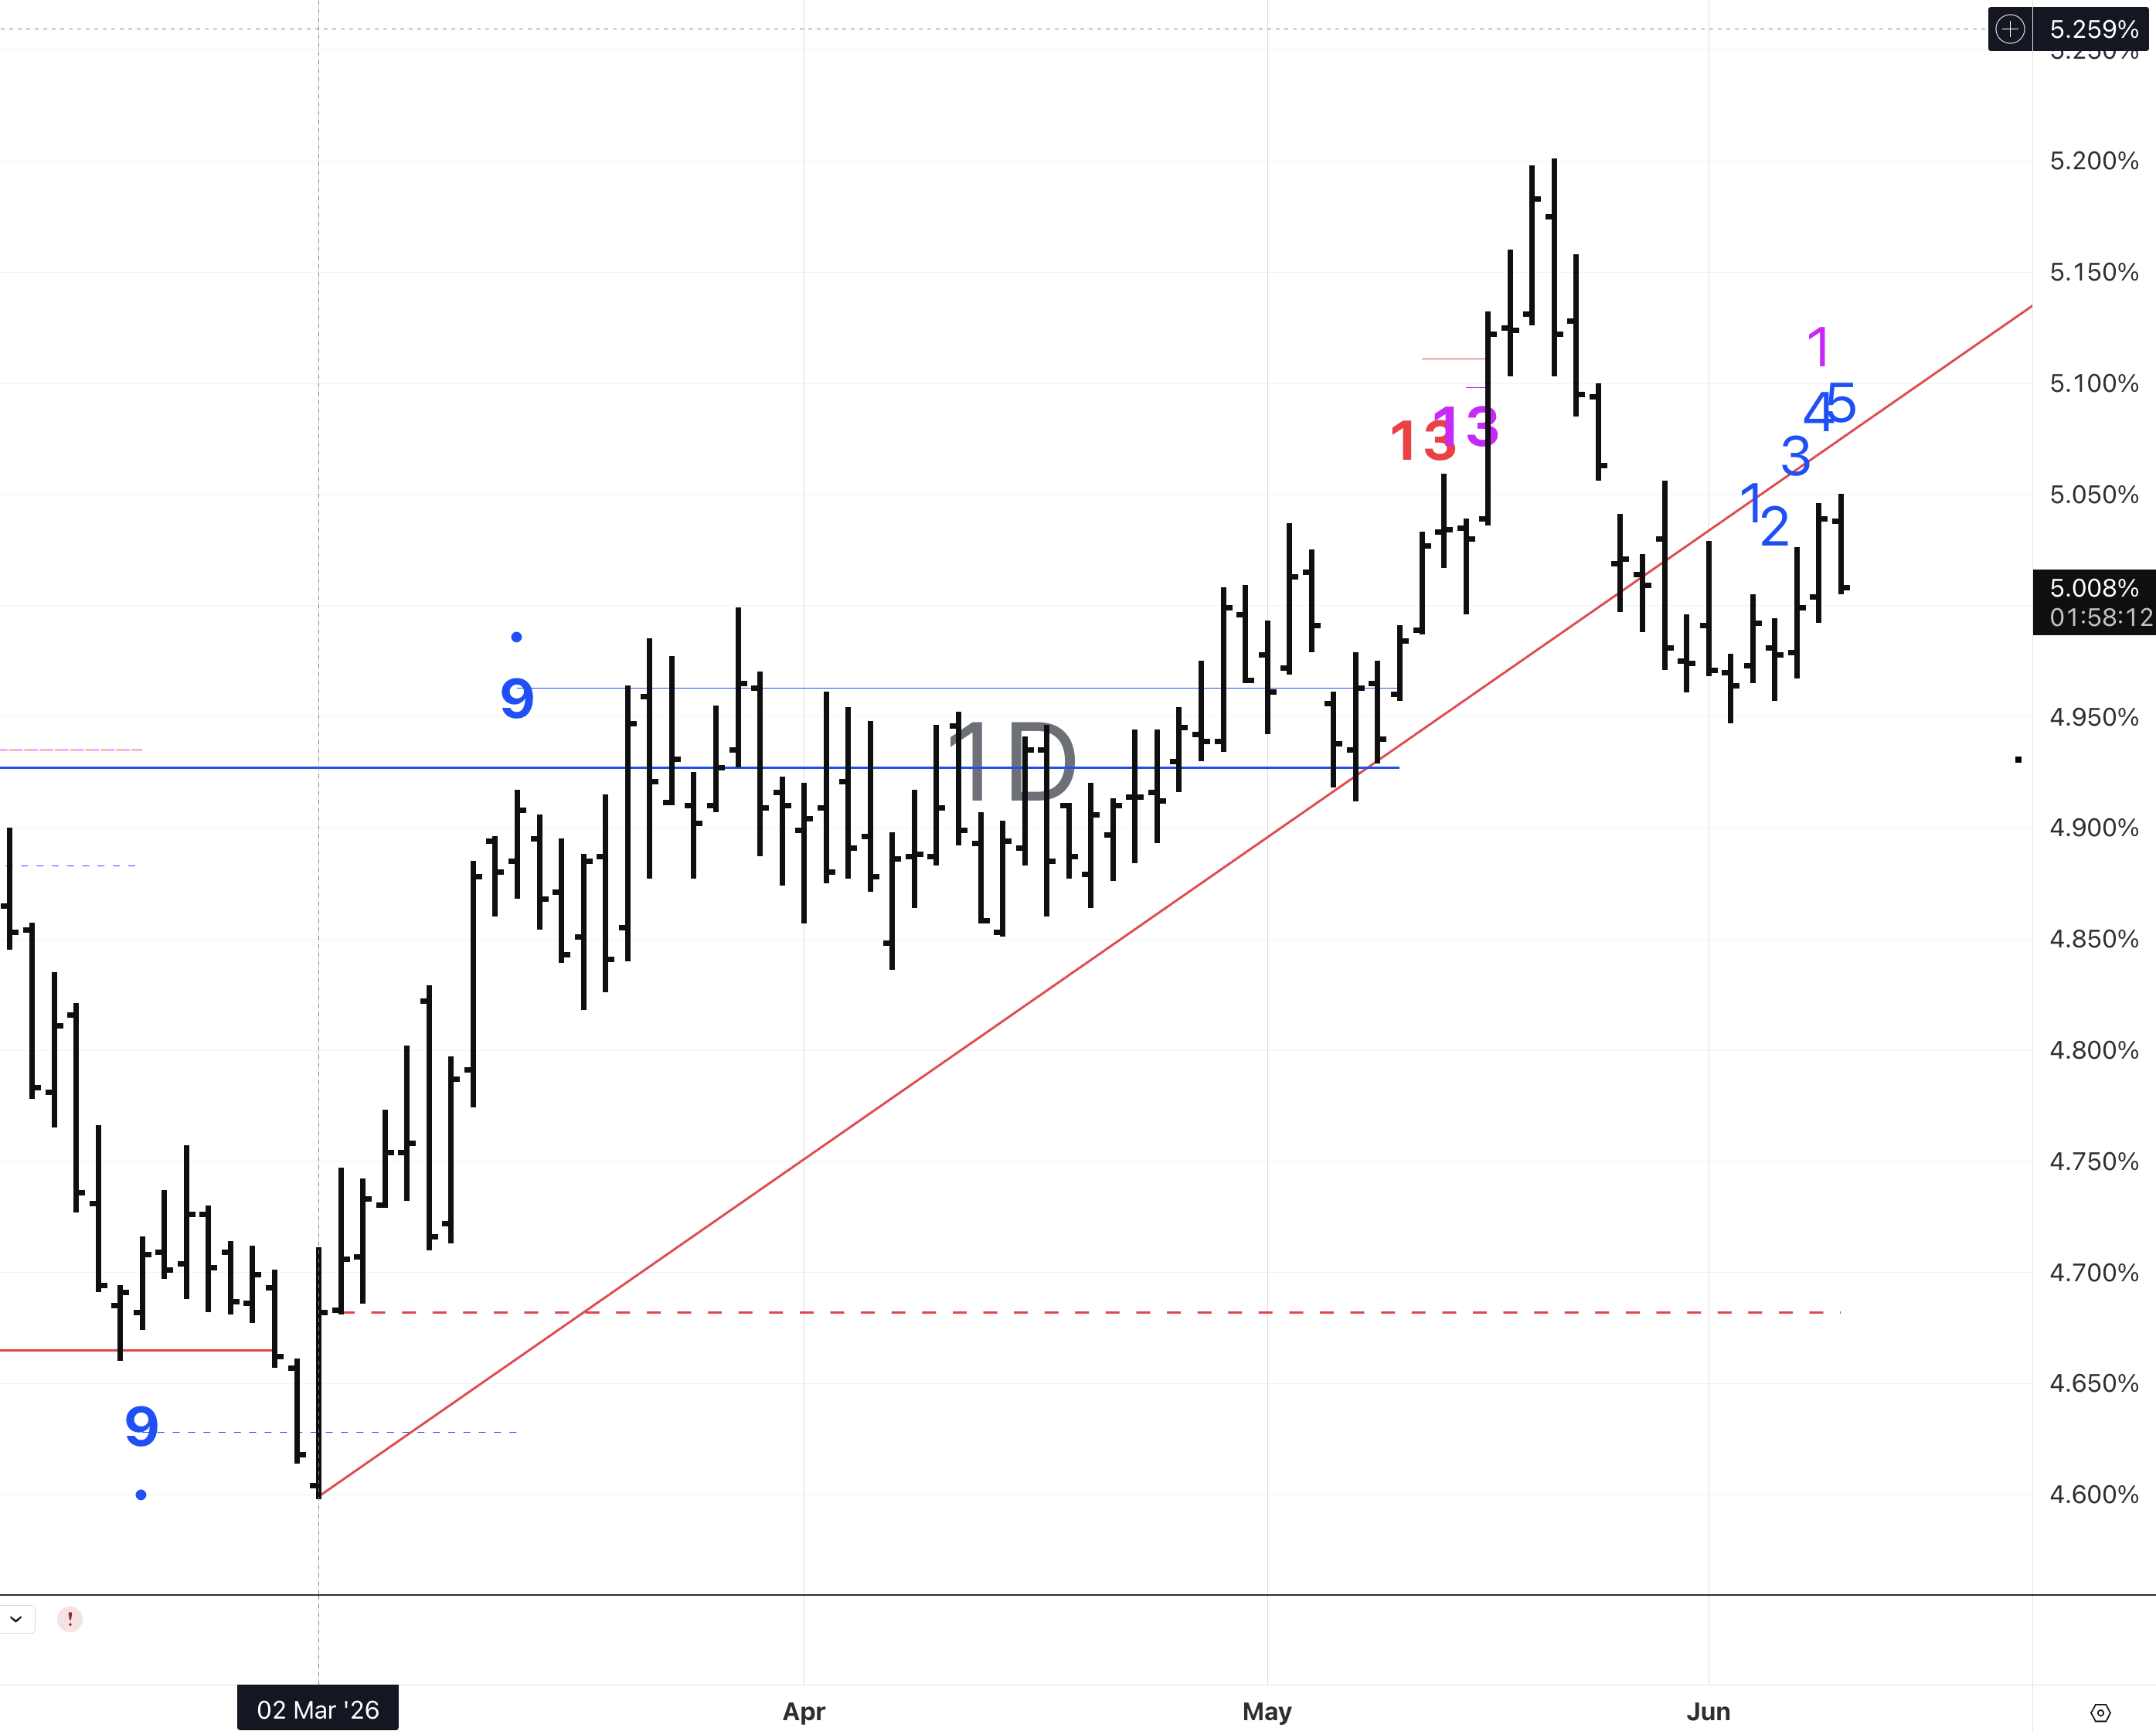
On the technical side, I’m still looking at the massive monthly buy setup across the tplex which is active. The buys were delayed due to the moves in oil and jobs but the technical setup still seems anchored to the long end coming off especially with the flattening that we just saw. I’m eying this last push near 5.05% on the 30yr as a near term level.